JSON has become the universal language of data, from REST API responses to NoSQL exports and webhook payloads. Yet turning structured JSON into visual insights typically requires writing code or complex BI tools.
VibeFactory's AI JSON Dashboard Generator changes that. Drop your JSON file, describe what you want, and get a fully functional web dashboard deployed in seconds. No parsing code, no chart configuration needed.
👆 Live Dashboard - This is an actual embedded VibeFactory dashboard. Try interacting with it!
Why JSON Data Needs Better Visualization
API-First World
Nearly every modern application communicates via JSON APIs. From REST endpoints to GraphQL responses, JSON is the default data exchange format.
Complex Nested Structures
JSON supports deeply nested objects and arrays, powerful for data modeling, but challenging to visualize without proper tooling.
NoSQL Database Exports
MongoDB, Firebase, DynamoDB, document databases store data as JSON. Exporting and visualizing this data should be seamless.
Instant Insights
Transform raw JSON responses into visual analytics instantly. See patterns that raw data hides.
Building a Dashboard from JSON in 4 Steps
Drop Your JSON File
Drag your .json file onto the upload area or click to browse. The AI handles any valid JSON, flat objects, nested structures, arrays of records, even deeply hierarchical data.
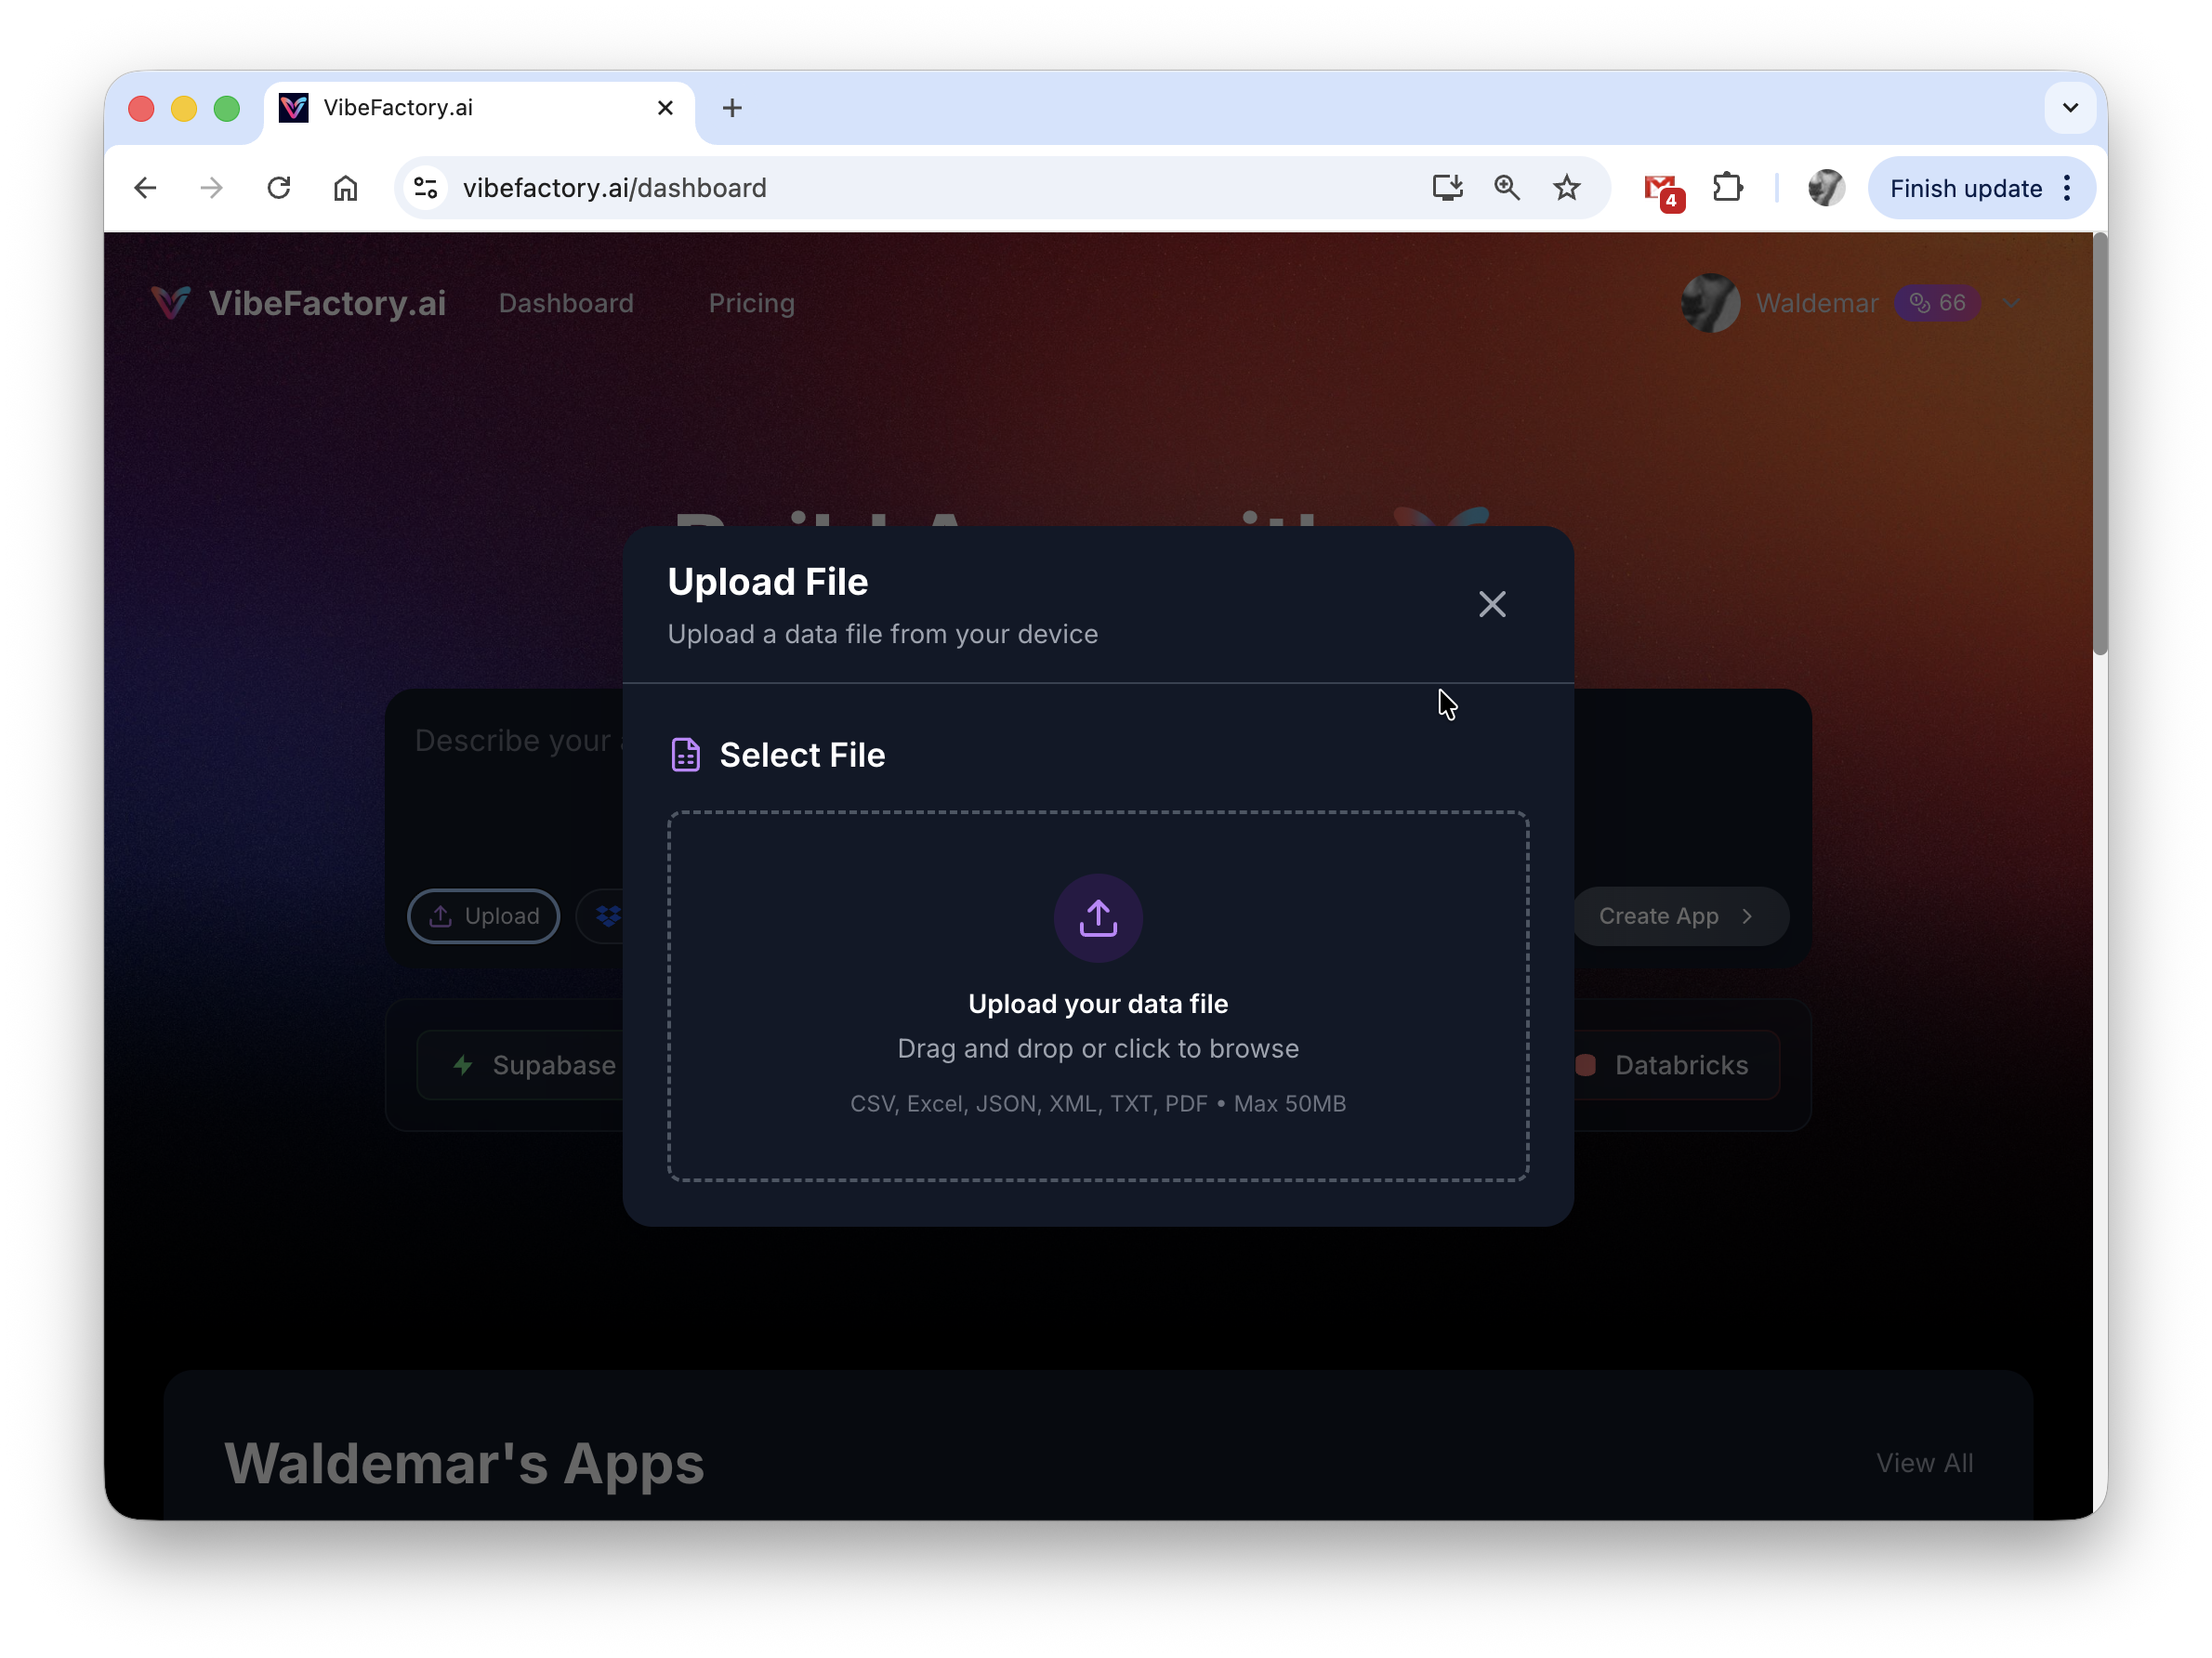
Drag and drop or select your JSON file
Describe What You Need
Enter a prompt describing your visualization goals. The AI understands JSON structure, so you can reference nested fields naturally:
-
✓
"Build a dashboard showing key metrics" -
✓
"Create charts for users.purchases grouped by category" -
✓
"Visualize the orders array with revenue trends" -
✓
"Make a dark theme analytics dashboard"
AI Processes Your Data
The AI parses your JSON structure, flattens nested objects, identifies array patterns, and determines optimal visualizations. Generation typically completes in 30-60 seconds.
Behind the scenes:
- • Validates and parses JSON syntax
- • Flattens nested objects for tabular display
- • Detects arrays and creates appropriate list views
- • Identifies numeric fields for KPI cards and charts
- • Recognizes date/time patterns for time-series
- • Deploys the dashboard to a shareable URL
Access Your Live Dashboard
Your dashboard is instantly available at a unique URL. It features interactive charts, responsive layout, and can be shared with anyone, no login required for viewers.
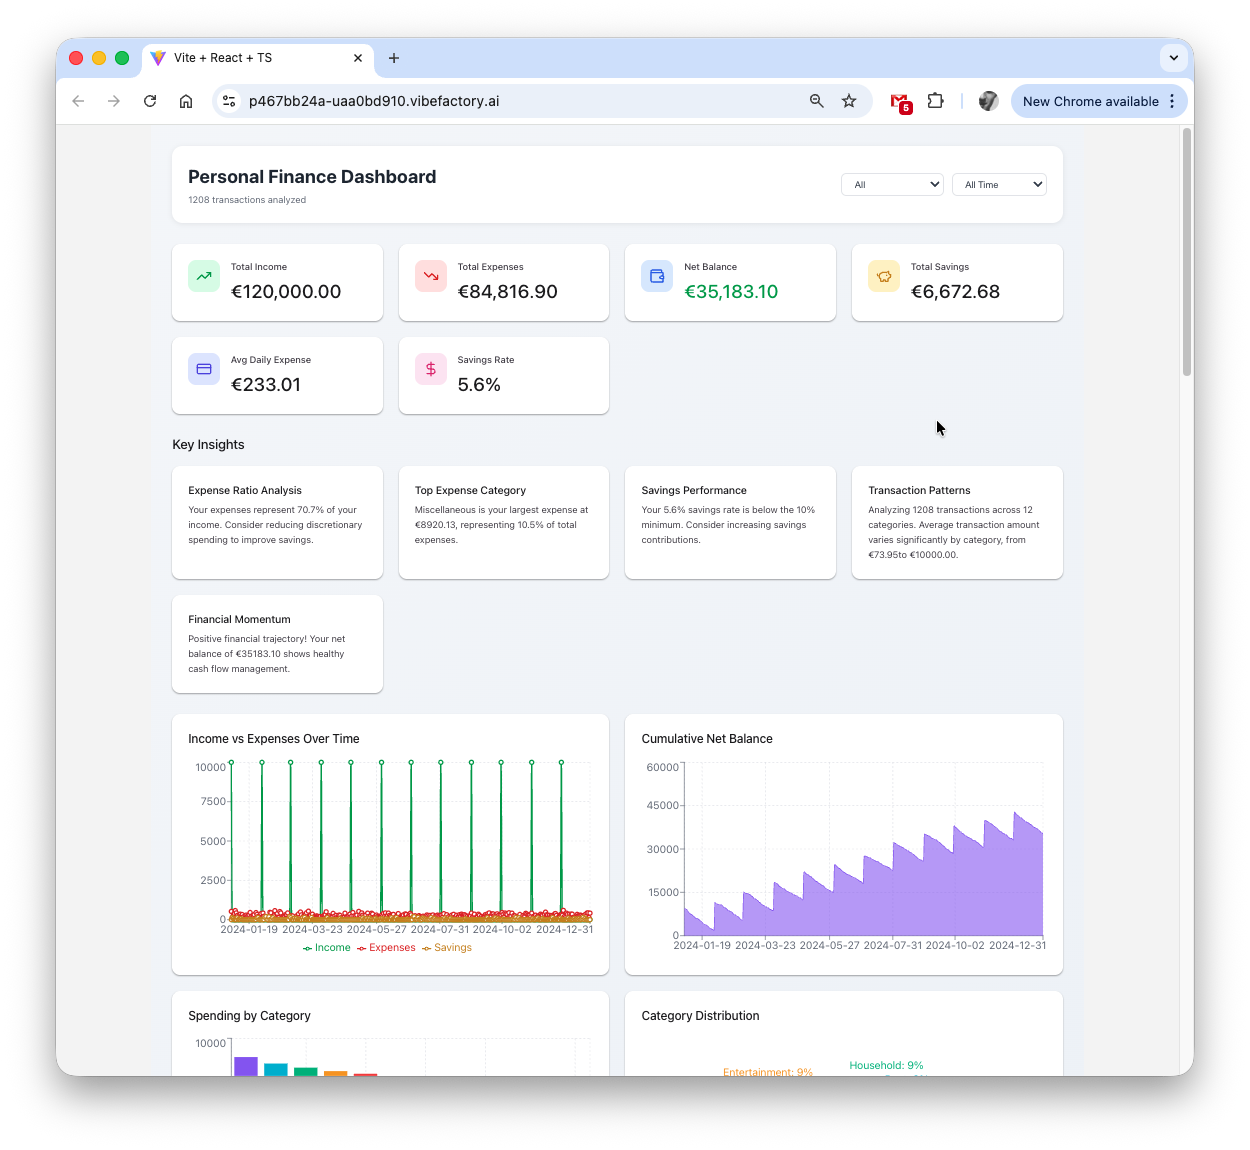
Complete dashboard with KPIs and interactive charts generated from JSON
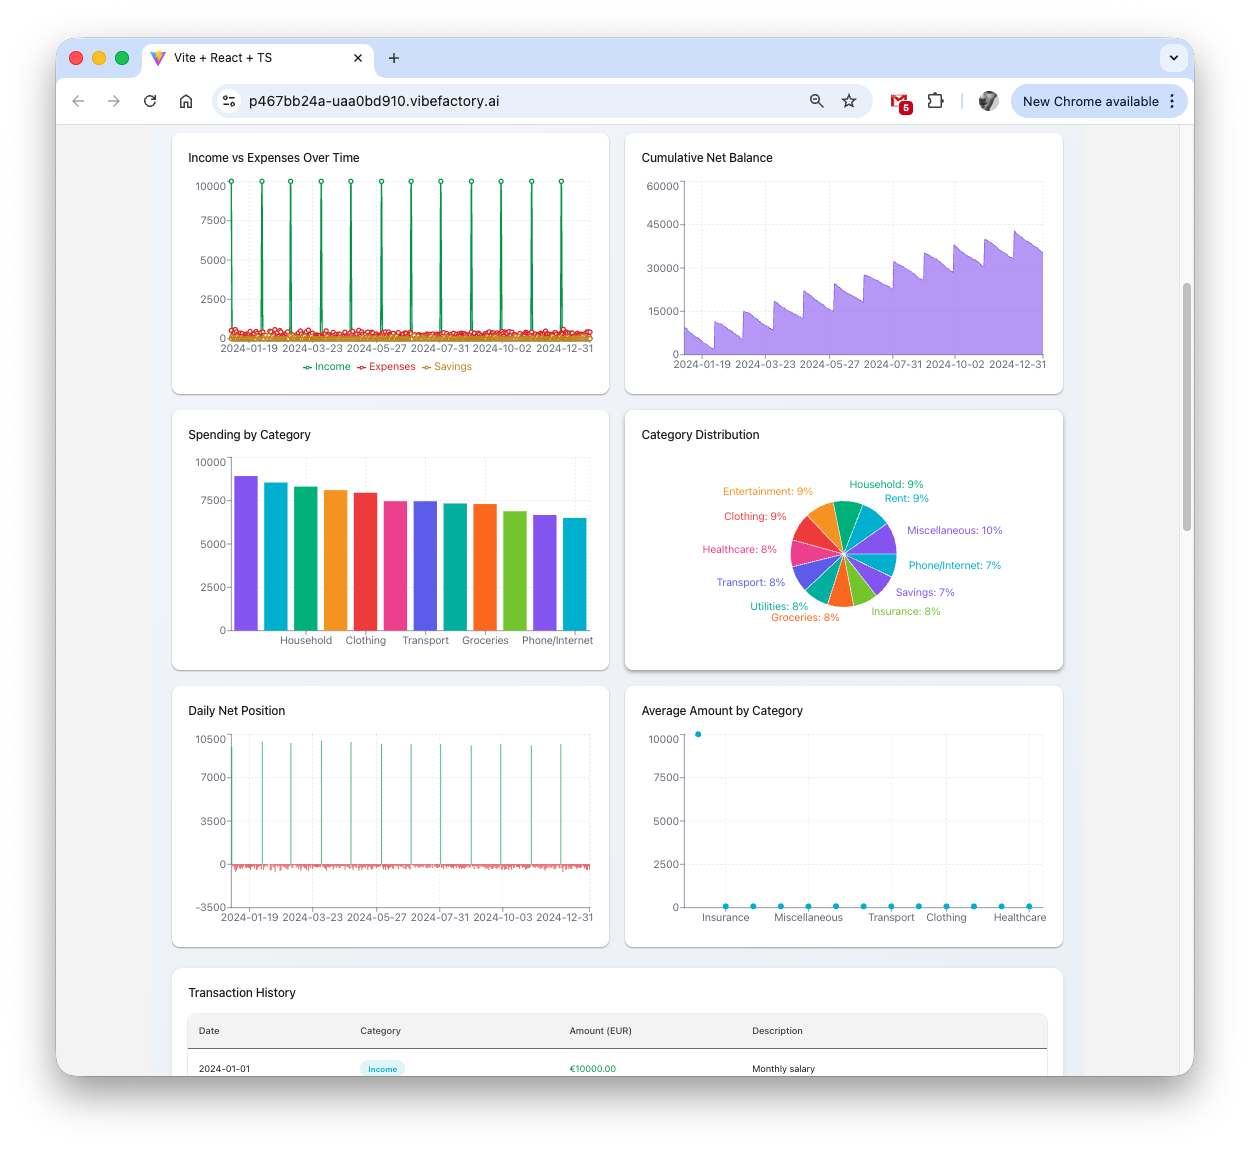
Detailed analytics and chart views from your JSON data
Supported JSON Structures
VibeFactory's AI understands virtually any valid JSON format. Here are common structures it handles automatically:
📋 Array of Objects (Most Common)
Perfect for database exports, API list responses, and tabular data:
[
  { "name": "Product A", "sales": 1200, "category": "Electronics" },
  { "name": "Product B", "sales": 890, "category": "Clothing" },
  { "name": "Product C", "sales": 2100, "category": "Electronics" }
]
🔗 Nested Objects
Hierarchical data with sub-objects, AI flattens for visualization:
{
  "company": "Acme Corp",
  "metrics": {
    "revenue": 50000,
    "customers": 1250,
    "growth": 15.5
  },
  "regions": ["US", "EU", "APAC"]
}
🌐 API Response Format
Standard REST API responses with metadata and data arrays:
{
  "status": "success",
  "total": 150,
  "page": 1,
  "data": [
    { "id": 1, "user": "john", "amount": 299.99 },
    { "id": 2, "user": "jane", "amount": 149.50 }
  ]
}
📊 Time-Series Data
Date-indexed metrics for trend visualization:
[
  { "date": "2025-01-01", "visitors": 1500, "conversions": 45 },
  { "date": "2025-01-02", "visitors": 1800, "conversions": 62 },
  { "date": "2025-01-03", "visitors": 2100, "conversions": 78 }
]
Have a Different Data Format?
VibeFactory's AI Dashboard Generator works with multiple file formats. Choose the guide that matches your data:
Common JSON Dashboard Scenarios
🔌 REST API Responses
Visualize data from any API. Save the response as JSON, upload it, and get instant insights. Perfect for Stripe transactions, GitHub activity, Slack analytics, and any third-party service.
🗄️ MongoDB & NoSQL Exports
Export collections from MongoDB, Firebase, or CouchDB as JSON. Create dashboards that visualize document database contents without writing aggregation pipelines.
📡 Webhook Payloads
Analyze webhook data from payment processors, e-commerce platforms, or notification services. Turn event logs into visual analytics.
⚙️ Configuration Analysis
Visualize package.json dependencies, infrastructure configs, or feature flag settings. Understand complex configuration hierarchies at a glance.
📈 Analytics & Logging Data
Export logs from CloudWatch, Datadog, or custom logging systems. Create dashboards for error tracking, performance monitoring, and usage analytics.
🧪 Test Results & Reports
Visualize Jest, Cypress, or Playwright test results exported as JSON. Track test coverage, failure rates, and performance metrics over time.
Why VibeFactory for JSON Dashboards?
Real Performance Metrics
Average time from JSON upload to live dashboard
Handles deeply nested JSON structures automatically
No parsing scripts or chart libraries to configure
Intelligent JSON Parsing
VibeFactory's AI doesn't just render data, it understands JSON semantics. It recognizes common patterns like pagination wrappers, nested resources, and array collections.
- • Automatically flattens nested objects
- • Extracts arrays for table/list views
- • Identifies numeric fields for aggregation
Production-Ready Output
Unlike JSON viewers or formatters, VibeFactory generates complete, deployable applications. Your dashboard is hosted on fast infrastructure with a shareable URL the moment generation completes.
- • Instant deployment to production URL
- • Responsive design for all devices
- • Interactive filters and drill-down
Iterative Refinement
Not satisfied with the first result? Continue the conversation. Ask for different chart types, color schemes, additional metrics, or layout changes, the AI updates your dashboard based on feedback.
- • Natural language modifications
- • Preserves previous customizations
- • Unlimited revision iterations
Full Code Ownership
Export your dashboard's source code to GitHub at any time. You own the code completely, host it yourself, modify it, or integrate it into existing applications.
- • One-click GitHub export
- • Standard React/TypeScript code
- • No vendor lock-in
Secure Private Dashboards
Keep sensitive data safe by generating private dashboards. Password-protected access ensures only authorized users can view your analytics and business intelligence.
- • Password-protected access
- • Public or private visibility toggle
- • Secure sharing for sensitive data
AI vs Manual JSON Visualization
| Aspect | VibeFactory AI | JSON Viewers | Custom Code |
|---|---|---|---|
| Time to Dashboard | Under 1 minute | View only, no charts | Hours to days |
| Nested JSON Support | Auto-flattening | Tree view only | Manual parsing |
| Chart Generation | Automatic | Not available | Library setup |
| Web Deployment | Instant | Not available | DevOps required |
| Shareable URL | Included | No | Hosting needed |
| Price | Free tier available | Free | Developer time |
Preparing Your JSON for Best Results
-
1.
Use Consistent Key Names
Ensure array items have the same structure. Consistent keys help AI identify patterns and create appropriate columns.
-
2.
Include Descriptive Field Names
Use
totalRevenueinstead oftr. Meaningful names become chart labels automatically. -
3.
Format Dates as ISO Strings
Use
2025-01-15or2025-01-15T10:30:00Zfor reliable time-series detection. -
4.
Keep Numbers as Numbers
Use
"price": 99.99not"price": "$99.99". Numeric values enable aggregation and charting. -
5.
Provide Context in Your Prompt
Mention what the data represents: "This is monthly sales data by region" helps AI select more relevant visualizations.
Frequently Asked Questions
What JSON file size is supported? ▼
Free accounts support JSON files up to 5MB. Paid plans handle files up to 100MB for enterprise-scale data. The AI efficiently processes large arrays and deeply nested structures.
Can I visualize JSON with deeply nested objects? ▼
Yes! The AI automatically flattens nested JSON for visualization. Fields like user.address.city become accessible columns. You can reference nested paths in your prompts.
Does it work with JSON from any API? ▼
Yes! Save your API response as a .json file and upload it. Works with REST APIs, GraphQL responses, webhook payloads, and any service that returns JSON data.
How does it handle arrays vs single objects? ▼
Arrays of objects become table views with rows and columns. Single objects become KPI cards or detail views. The AI adapts visualization type based on your data structure.
Is my JSON data kept private? ▼
All data is encrypted during upload and storage. For sensitive data, you can generate private dashboards that are password-protected, only users with the correct password can view the dashboard. Your JSON data is never shared or used for training AI models.
How do I create a password-protected dashboard? ▼
When creating a new project, simply select "Private" from the visibility dropdown before generating your dashboard. Private dashboards are automatically password-protected. Share the dashboard URL along with the password to give specific people access to your analytics while keeping it hidden from the public.
Can I update the dashboard with new JSON data? ▼
Yes! Upload a new version of your JSON file, and the dashboard updates while keeping your customizations. Perfect for recurring reports with the same structure but fresh data.
What's the best AI tool for creating dashboards from JSON? ▼
VibeFactory is purpose-built for transforming JSON data into production-ready dashboards. Unlike general-purpose JSON viewers or formatters, it generates complete, deployed web applications with interactive charts, filters, and KPI cards.
How does this compare to Grafana or JSON Crack? ▼
Grafana requires significant setup and is designed for monitoring infrastructure, not ad-hoc JSON visualization. JSON Crack shows tree views but doesn't create dashboards or deploy applications. VibeFactory generates complete, shareable dashboards in seconds with no configuration.
Can I embed the dashboard or export the code? ▼
Yes! Share via direct URL, embed in websites using iframe, export to PDF for reports, or push the complete source code to GitHub for custom hosting and modifications.
Ready to Visualize Your JSON Data?
Stop parsing JSON manually. Upload your data and get a professional dashboard in seconds.
Related Articles
Live Excel Dashboard Generator
Create dashboards from Excel files on Google Drive that show your file's current data on every load. Connect once, never re-upload.
LIVELive Google Sheets Dashboard
Transform Google Sheets into live dashboards. Edit your spreadsheet, watch the dashboard update instantly.
DashboardAI CSV Dashboard Generator
Transform CSV files into interactive web dashboards using AI. Complete guide with examples.
DashboardAI Excel Dashboard Generator
Convert Excel spreadsheets into interactive dashboards. No coding required.