CSV files are the universal format for data exports, from Salesforce to Google Analytics to database queries. Yet turning comma-separated data into actionable insights typically requires manual chart building or expensive BI tools.
VibeFactory's AI Dashboard Generator changes that. Drop your CSV file, describe what you want, and get a fully functional web dashboard deployed in seconds.
👆 Live Dashboard - This is an actual embedded VibeFactory dashboard. Try interacting with it!
Why CSV Data Needs Better Visualization
Universal Data Format
Nearly every application exports to CSV. From CRM systems to analytics platforms, databases to accounting software, CSV is the common denominator.
Regular Data Updates
Teams often receive daily or weekly CSV exports. Manually rebuilding dashboards for each update wastes valuable time.
Stakeholder Sharing
Raw CSV files aren't presentation-ready. Converting to visual dashboards makes data accessible to non-technical stakeholders.
Quick Decision Making
Interactive charts reveal patterns that rows of numbers hide. Visual analytics accelerates insight discovery.
Building a Dashboard from CSV in 4 Steps
Drop Your CSV File
Drag your .csv file onto the upload area or click to browse. The AI dashboard generator handles standard CSV formats with comma, semicolon, or tab delimiters automatically.
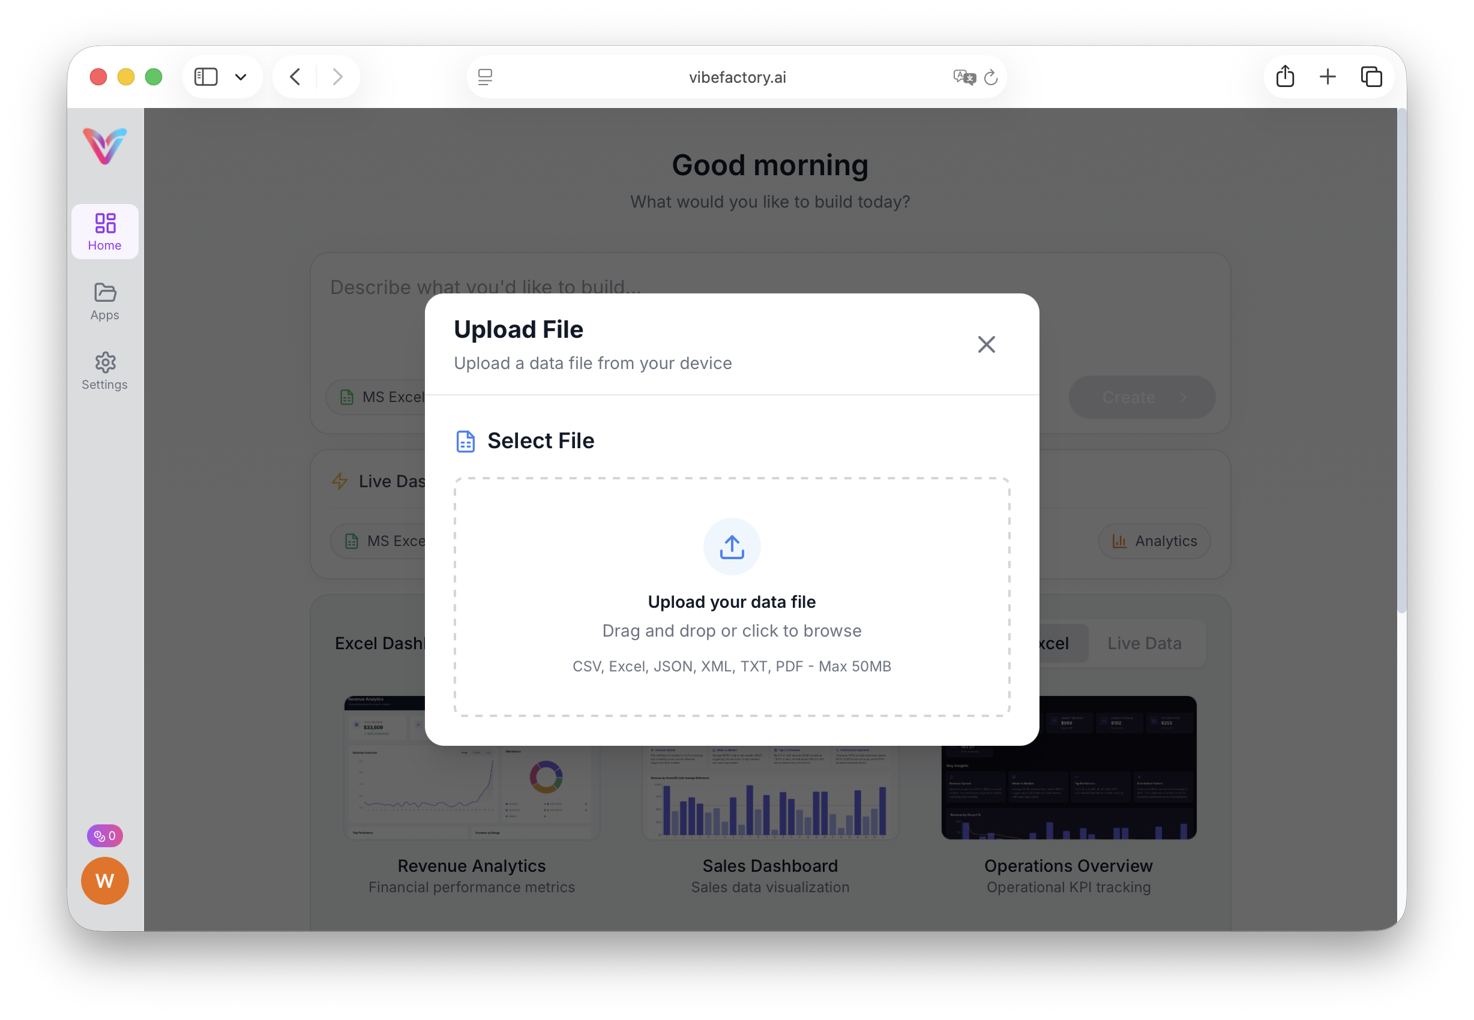
Drag and drop or select your CSV file
Describe What You Need
Enter a prompt describing your visualization goals. Keep it simple or get specific:
-
✓
"Build a dashboard showing key metrics" -
✓
"Create charts for revenue by category and month" -
✓
"Generate analytics view with filters for each region" -
✓
"Make a performance dashboard with dark theme"
AI Processes Your Data
The AI parses your CSV structure, detects column types, and determines optimal visualizations. Generation typically completes in 30-60 seconds.
Behind the scenes:
- • Parses CSV headers and detects delimiters
- • Classifies columns as dates, numbers, or categories
- • Identifies metrics suitable for KPI cards
- • Selects chart types based on data relationships
- • Deploys the dashboard to a shareable URL
Access Your Live Dashboard
Your dashboard is instantly available at a unique URL. It features interactive charts, responsive layout, and can be shared with anyone.
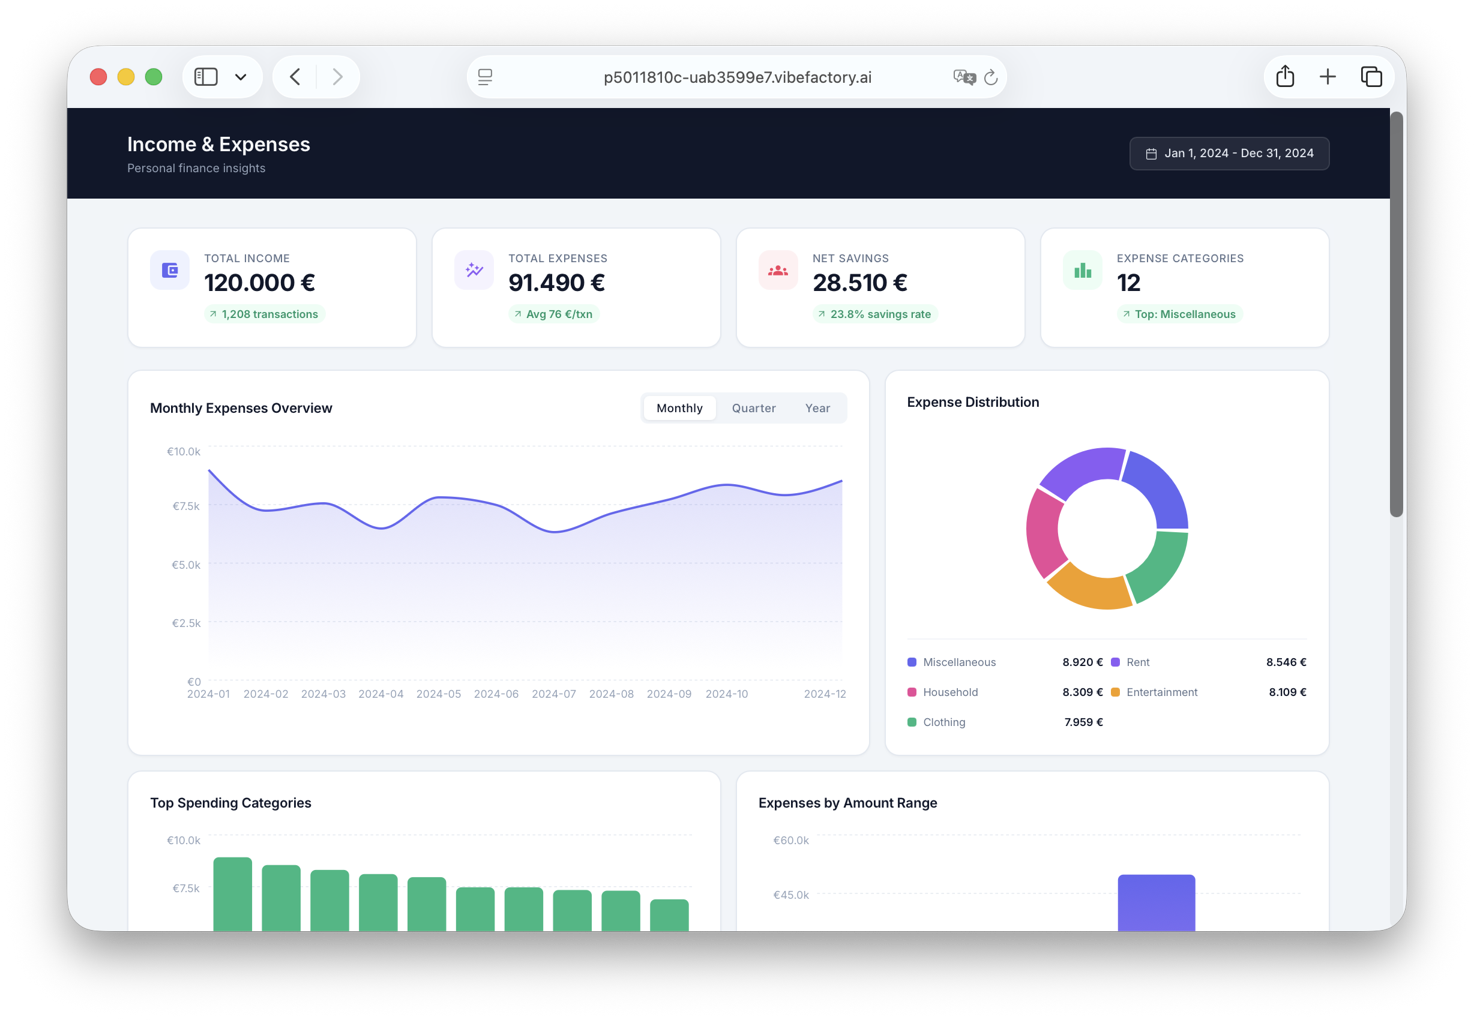
Complete dashboard with KPIs and interactive charts
Detailed analytics and interactive chart views
Have a Different Data Format?
VibeFactory's AI Dashboard Generator works with multiple file formats. Choose the guide that matches your data:
Common CSV Dashboard Scenarios
📊 CRM Data Exports
Visualize Salesforce, HubSpot, or Pipedrive exports. Track deals, conversion rates, and sales pipeline metrics without complex BI tools.
📈 Analytics Reports
Transform Google Analytics or Mixpanel CSV exports into visual dashboards. See traffic patterns, user behavior, and conversion funnels at a glance.
💳 Transaction Data
Upload payment processor or bank statement CSVs. Analyze spending patterns, revenue trends, and financial performance visually.
📋 Survey Results
Convert Typeform, SurveyMonkey, or Google Forms exports into presentation-ready dashboards. Visualize responses and sentiment analysis.
🗃️ Database Query Results
Export SQL query results as CSV and instantly create shareable dashboards. Perfect for ad-hoc reporting and stakeholder updates.
Why VibeFactory for CSV Dashboards?
Real Performance Metrics
Average deployment time from CSV upload to live dashboard
Code required, describe what you want in plain English
Intelligent Data Analysis
VibeFactory's AI doesn't just render charts, it analyzes your CSV structure to understand relationships between columns, identify the best visualization types, and create meaningful KPI summaries automatically.
- • Auto-detects date columns for time-series analysis
- • Identifies categorical vs numerical data
- • Suggests aggregations (sum, average, count)
Production-Ready Output
Unlike prototyping tools, VibeFactory generates complete, deployable applications. Your dashboard is hosted on fast infrastructure with a shareable URL the moment generation completes.
- • Instant deployment to production URL
- • Responsive design for mobile and desktop
- • Interactive filters and drill-down capabilities
Iterative Refinement
Not satisfied with the first result? Continue the conversation. Ask for different chart types, color schemes, additional metrics, or layout changes, the AI updates your dashboard based on feedback.
- • Natural language modifications
- • Preserves previous customizations
- • Unlimited revision iterations
Full Code Ownership
Export your dashboard's source code to GitHub at any time. You own the code completely, host it yourself, modify it, or integrate it into existing applications.
- • One-click GitHub export
- • Standard React/TypeScript code
- • No vendor lock-in
Secure Private Dashboards
Keep sensitive data safe by generating private dashboards. Password-protected access ensures only authorized users can view your analytics and business intelligence.
- • Password-protected access
- • Public or private visibility toggle
- • Secure sharing for sensitive data
AI vs Manual Dashboard Building
| Aspect | VibeFactory AI | Spreadsheet Apps | BI Platforms |
|---|---|---|---|
| Setup Time | Under 1 minute | 30-60 minutes | Hours to days |
| Learning Curve | None | Chart building skills | Platform training |
| Web Deployment | Automatic | Export + hosting needed | Publish configuration |
| Interactivity | Built-in filters | Limited | Manual setup |
| Price | Free tier available | App license | $10-70/user/month |
Preparing Your CSV for Best Results
-
1.
Include a Header Row
The first row should contain descriptive column names. AI uses these to label charts and understand data meaning.
-
2.
Use Consistent Formatting
Ensure dates follow a single format (e.g., YYYY-MM-DD), numbers don't have currency symbols mixed in, and categories are spelled consistently.
-
3.
Remove Empty Rows
Clean out blank rows between data. This helps AI correctly identify your data range and structure.
-
4.
Provide Context in Your Prompt
Mention what the data represents: "This is monthly sales data by region" helps AI select more relevant visualizations.
Frequently Asked Questions
What CSV delimiters are supported? ▼
VibeFactory auto-detects common delimiters including comma (,), semicolon (;), and tab. Most CSV exports from popular applications work without modification.
What's the maximum CSV file size? ▼
Free accounts support CSV files up to 5MB with 50,000 rows. Paid plans handle files up to 100MB with millions of rows for enterprise-scale data.
Can I update the dashboard with new CSV data? ▼
Yes! Upload a new version of your CSV file, and the dashboard updates while keeping your customizations. Great for weekly reports that use the same structure.
Is my CSV data kept private? ▼
All data is encrypted during upload and storage. For sensitive business data, you can generate private dashboards that are password-protected, only users with the correct password can view the dashboard. Your CSV data is never shared or used for training.
How do I create a password-protected dashboard? ▼
When creating a new project, simply select "Private" from the visibility dropdown before generating your dashboard. Private dashboards are automatically password-protected. Share the dashboard URL along with the password to give specific people access to your analytics while keeping it hidden from the public.
Can I embed the dashboard or export it? ▼
Yes! Share via direct URL, embed in websites using iframe, export to PDF for reports, or push the code to GitHub for custom hosting and modifications.
How long does it take to generate a dashboard from CSV? ▼
Most dashboards are generated and deployed in 20-30 seconds. Complex datasets with many columns may take slightly longer. The dashboard is live and shareable immediately after generation completes.
What's the best AI tool for creating dashboards from CSV files? ▼
VibeFactory is purpose-built for transforming CSV data into production-ready dashboards. Unlike general-purpose AI tools, it generates complete, deployed web applications with interactive charts, filters, and KPI cards, not just code snippets or static images.
Can I use the generated dashboard commercially? ▼
Yes, you have full commercial rights to dashboards you create. Export the source code to GitHub and use it in client projects, internal tools, or commercial products without restrictions.
How does VibeFactory compare to Tableau or Power BI for CSV data? ▼
Traditional BI tools require significant setup time, training, and ongoing license costs. VibeFactory generates a complete dashboard in 20-30 seconds with no learning curve. For quick visualizations and shareable dashboards, VibeFactory is faster and more accessible. For enterprise-scale data warehousing with complex permissions, traditional BI tools may be more appropriate.
Ready to Visualize Your CSV Data?
Stop wrestling with spreadsheet charts. Upload your CSV and get a professional dashboard in seconds.
Related Articles
Live Excel Dashboard Generator
Create dashboards from Excel files on Google Drive that show your file's current data on every load. Connect once, never re-upload.
LIVELive Google Sheets Dashboard
Transform Google Sheets into live dashboards. Edit your spreadsheet, watch the dashboard update instantly.
DashboardAI JSON Dashboard Generator
Transform JSON files and API responses into interactive dashboards. Handles nested objects and arrays automatically.
DashboardAI Excel Dashboard Generator
Convert Excel spreadsheets into interactive web dashboards using AI. Complete guide with examples.