Google Sheets is the go-to collaboration tool for teams worldwide. But when it comes to creating dashboards, most solutions require you to export data, upload it, and repeat the process every time something changes.
VibeFactory's Live Dashboard Generator eliminates this friction entirely. Connect your Google Sheets once, and your dashboard stays current with it. When your dashboard loads, it fetches the latest data straight from your spreadsheet, and a Refresh button pulls the newest data on demand. No re-uploading, no republishing.
Why Google Sheets + Live Dashboards?
Google Sheets already lets your whole team edit together. Your dashboard builds on that: multiple team members editing the same spreadsheet? Everyone who opens the live dashboard sees the sheet's current data.
👆 Live Dashboard - This is an actual embedded VibeFactory dashboard. Try interacting with it!
Using Excel Files Instead?
If your data is in Excel (.xlsx) format stored on Google Drive, we have a dedicated guide for you:
Why Google Sheets is Perfect for Live Dashboards
Built-in Collaboration
Multiple team members can edit simultaneously. Everyone who opens the dashboard sees the sheet's current data.
Always in the Cloud
No file syncing needed, your data is already in Google Drive, ready to connect to a live dashboard.
Easy Integrations
Google Sheets connects to hundreds of data sources. Import data from forms, APIs, and other apps automatically.
Free to Use
Google Sheets is free with a Google account. Combined with VibeFactory's free tier, you get live dashboards at zero cost.
Secure Private Dashboards
Keep sensitive data safe with password-protected private dashboards. Only authorized users with the correct password can view your analytics.
How to Create a Live Google Sheets Dashboard in 3 Steps
Open VibeFactory Dashboard
Navigate to the VibeFactory dashboard and start a new project. You'll see options to connect various data sources including Google Sheets.
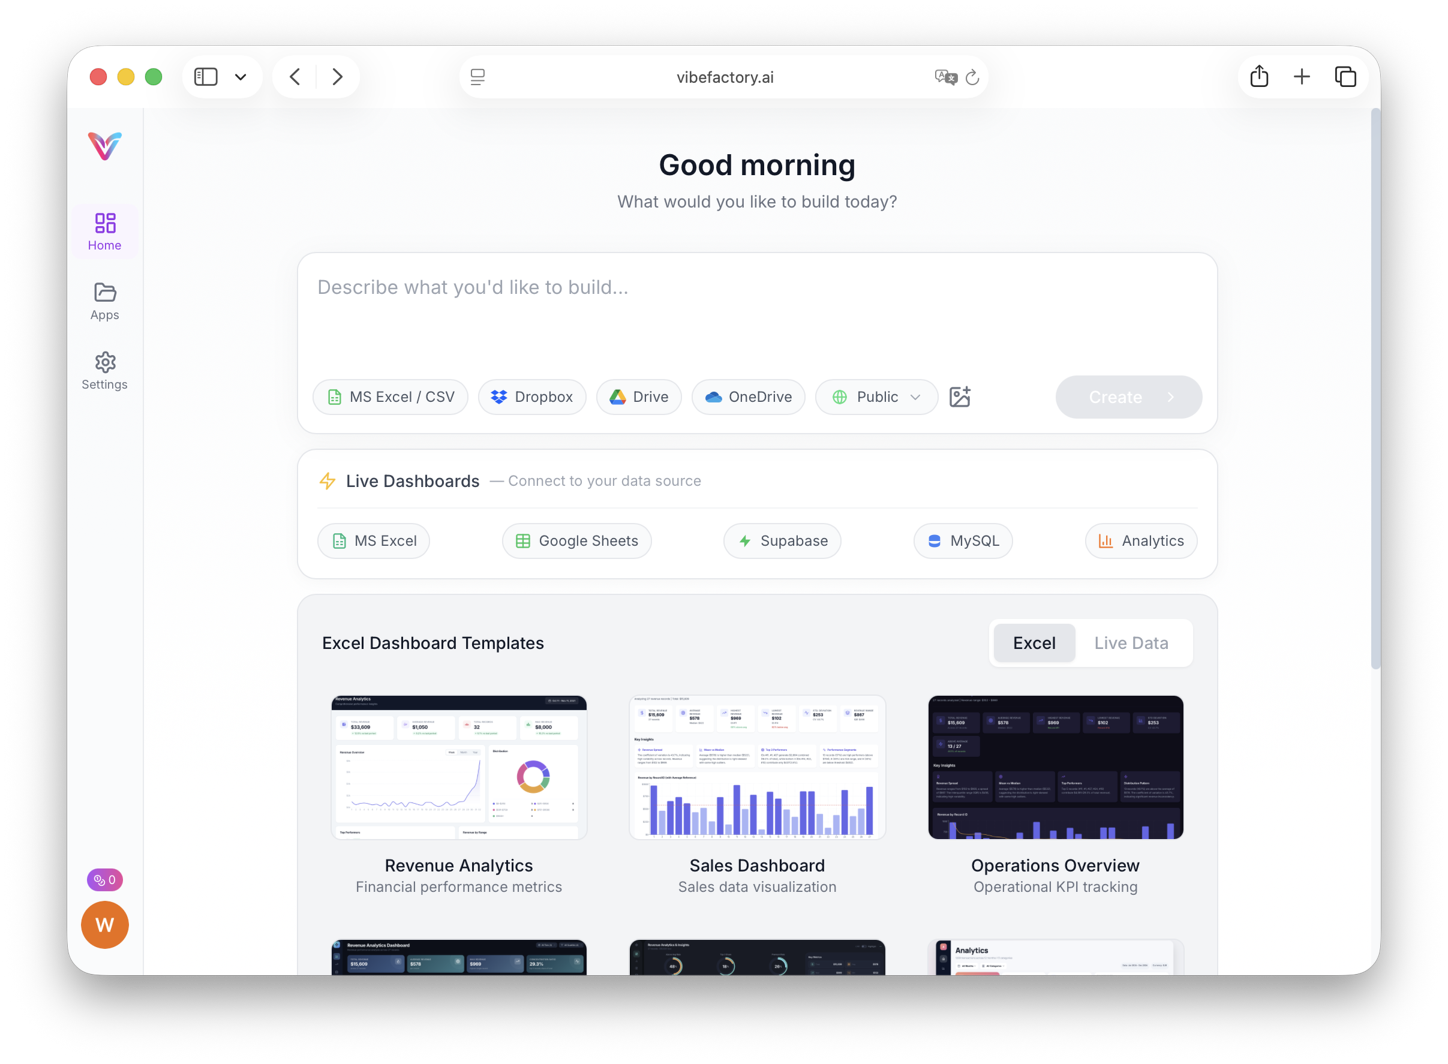
The VibeFactory dashboard interface
Select Google Sheets from Drive
Click the "MS Excel" button (which also works with Google Sheets) and select your spreadsheet from Google Drive. Google Sheets files are automatically detected and converted.
Important: File Sharing Requirements
For your dashboard to access the Google Sheets, you must do ONE of the following:
- Option 1: Make the spreadsheet public - Set sharing to "Anyone with the link can view"
- Option 2: Share with our service account - When you select a file, we'll show you the service account email to share with
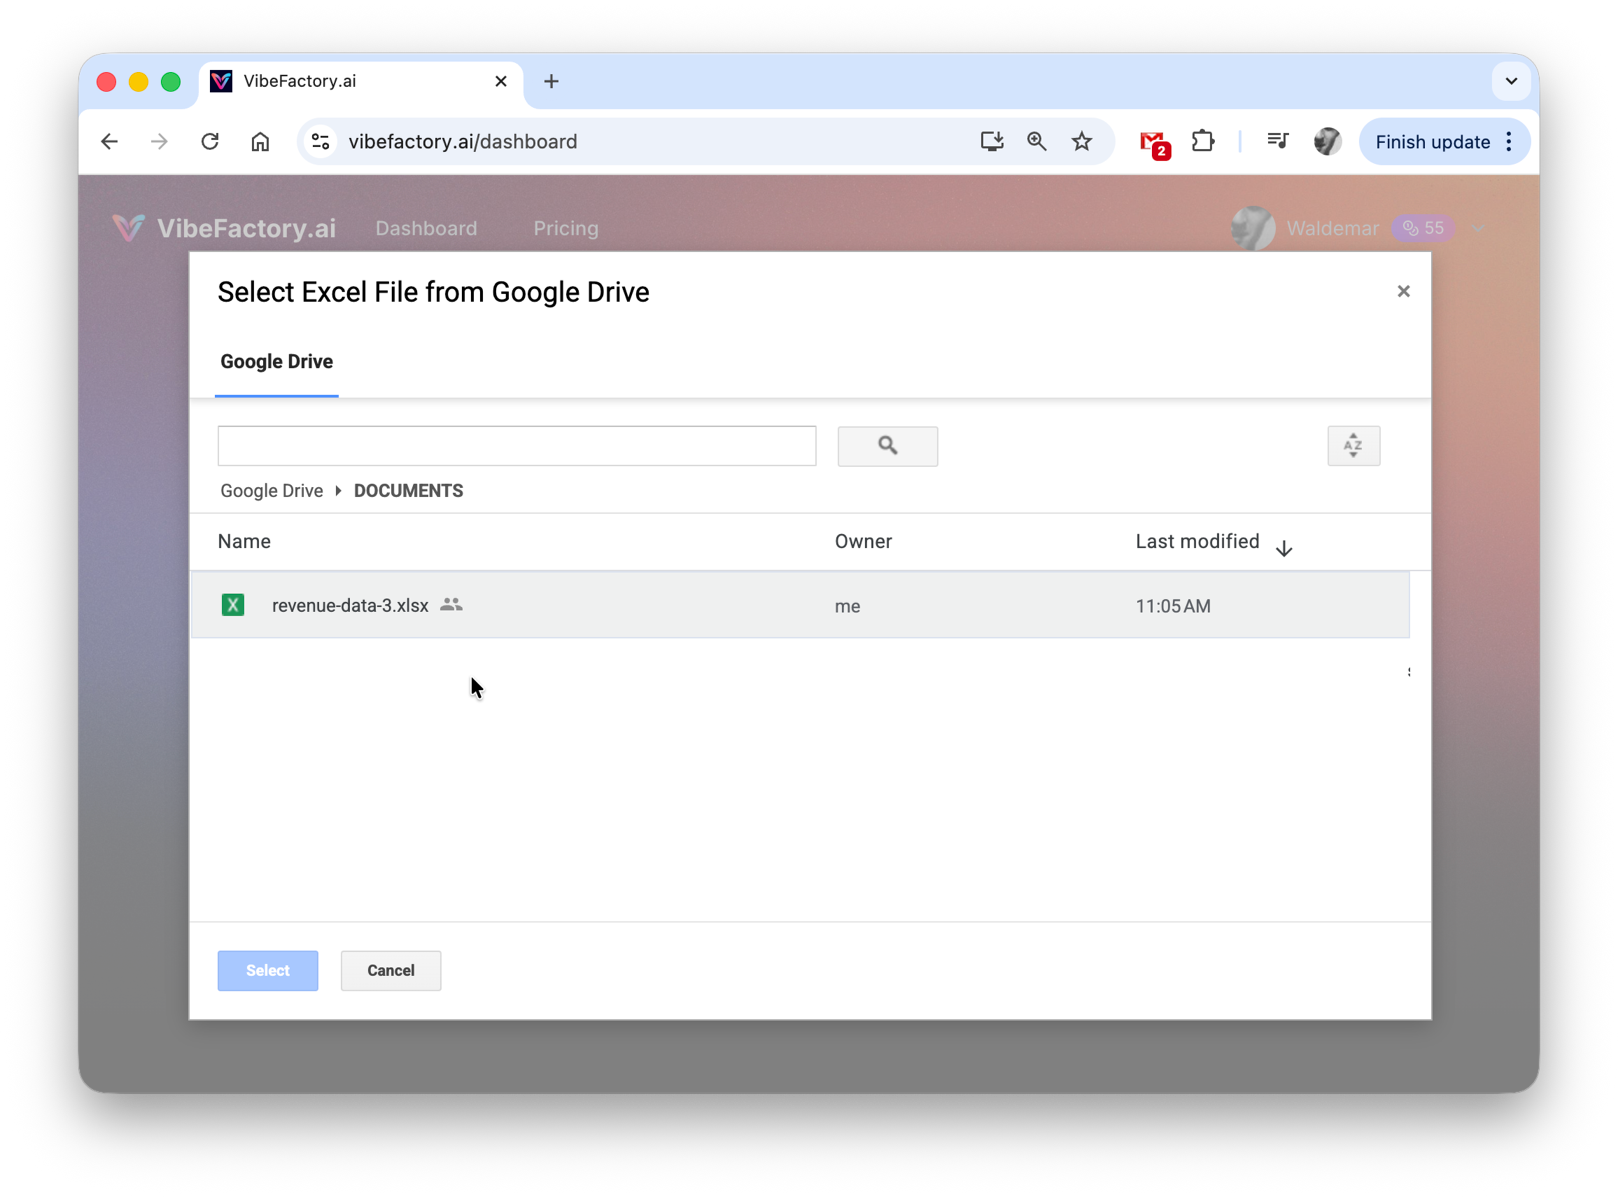
Select your Google Sheets file from Google Drive
Enter Your Prompt and Generate
Type a simple prompt describing what you want. The AI will analyze your Google Sheets data and generate a live dashboard that stays connected to your spreadsheet.
Example prompts:
- •
"Generate dashboard for team metrics" - •
"Create sales dashboard with weekly trends" - •
"Build project tracking dashboard"
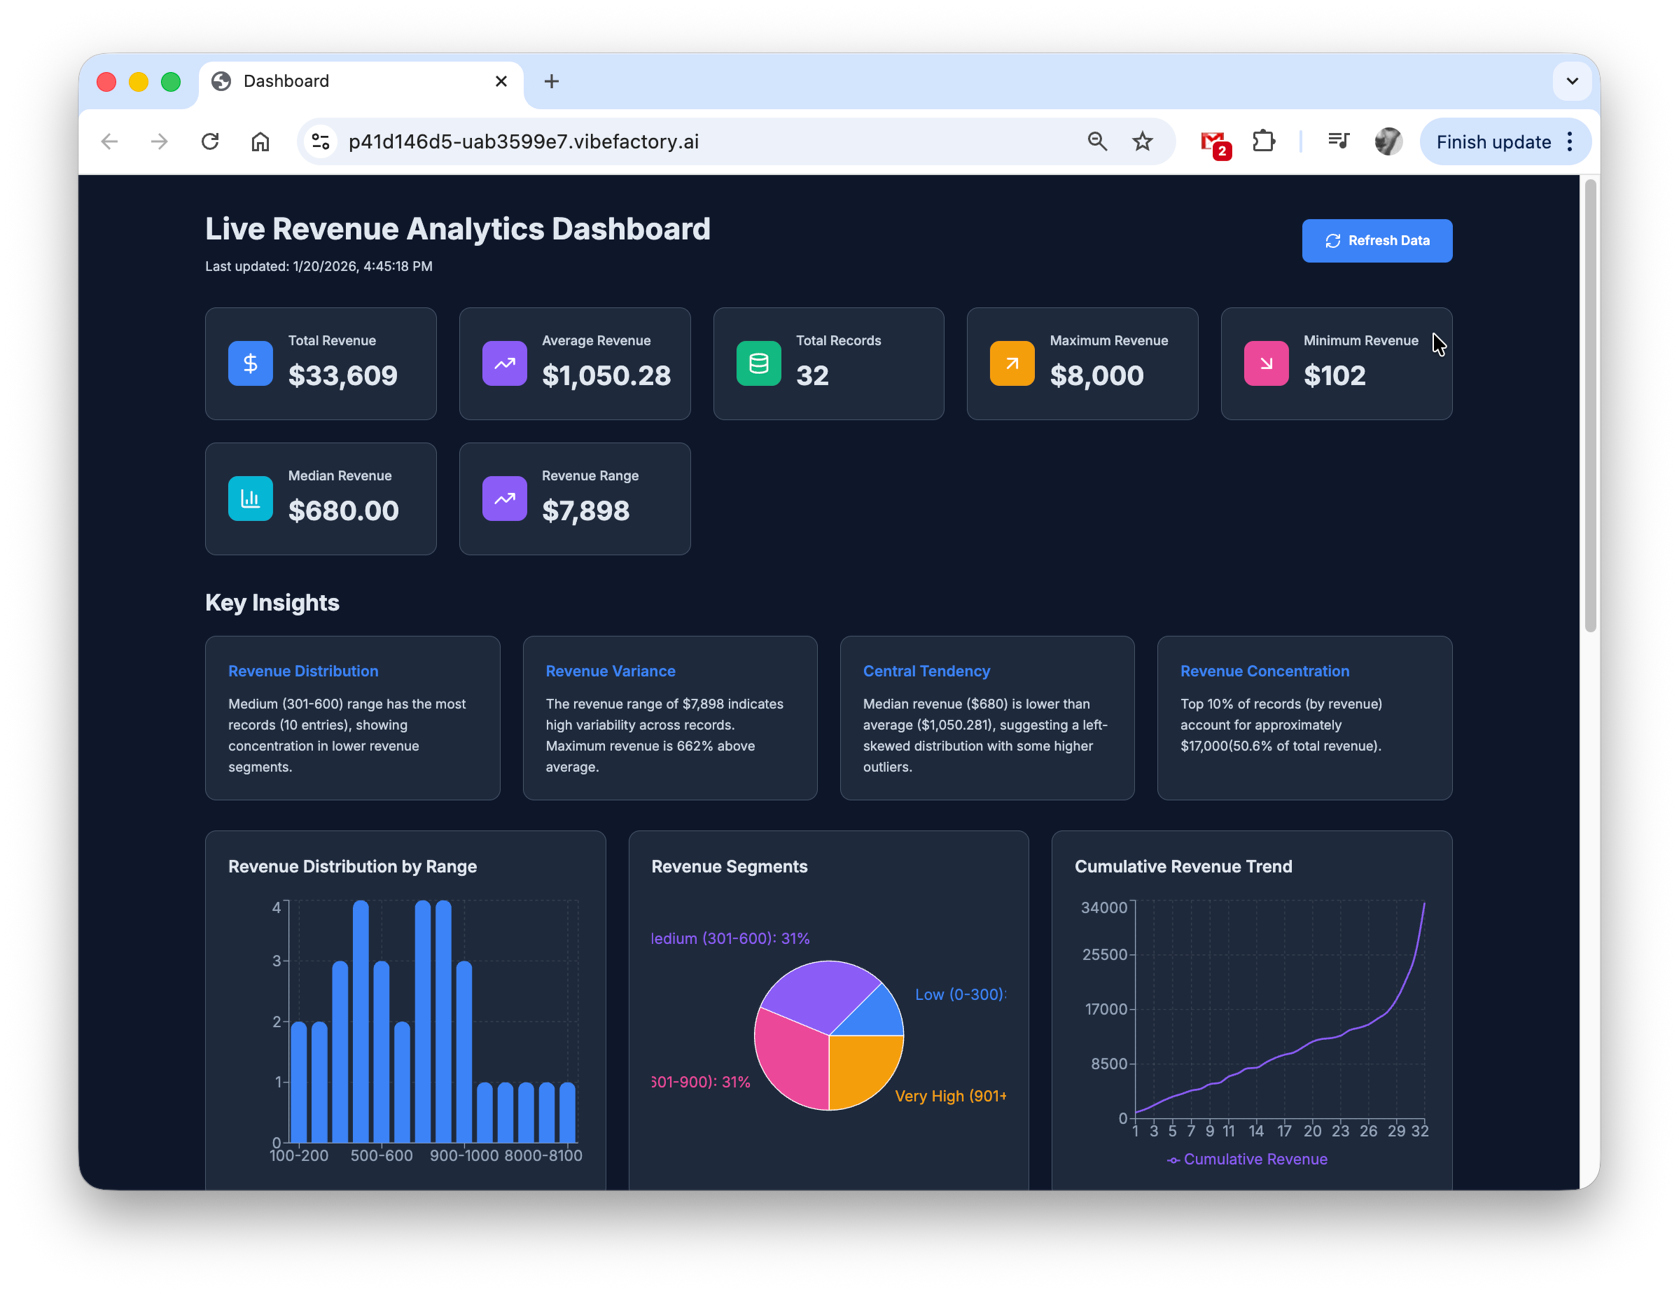
Your live dashboard, connected to your Google Sheets
Automated Google Sheets Dashboards, Without Re-uploading
An automated Google Sheets dashboard should remove every manual step between your spreadsheet and your charts, and that is exactly what this pipeline does. You connect your sheet once, the AI reads your columns and builds the charts, KPI cards, and tables, and the published dashboard fetches your sheet's current data every time anyone opens it. There are no exports, no copy-paste sessions, and no re-uploading when the numbers change.
You never rebuild the dashboard after edits either: update the sheet, and the next page load shows the latest values. The same workflow powers live Excel dashboards from Google Drive, so teams that mix both formats can automate their reporting with one tool.
Real-Time vs Refresh-on-Load: What Live Means Here
Searching for a real-time dashboard for Google Sheets? It helps to be precise about terms. True real-time streaming tools use websockets or push connections to update a screen while it stays open. That approach is built for operations monitoring (server metrics, trading desks) and comes with heavy infrastructure to set up and maintain.
VibeFactory dashboards work differently, and intentionally so: they fetch the latest data from your sheet every time the page loads, and viewers can press Refresh to pull current numbers on demand. We do not stream changes to an open page. For reports, team dashboards, and stakeholder links, refresh-on-load is the practical fit: every visit shows current data, and nobody has to maintain a pipeline to get it. Working in Excel instead? See how to create an Excel dashboard that updates automatically.
Perfect for Team Collaboration
How Teams Use Live Google Sheets Dashboards
- ✓ Sales teams update numbers in Sheets → Managers see live pipeline dashboard
- ✓ Project managers track tasks in Sheets → Stakeholders view live progress
- ✓ Finance teams maintain budgets in Sheets → Execs see current spend at every glance
- ✓ Operations log metrics in Sheets → Everyone monitors live KPIs
Live Workflow
Team edits Google Sheets → Dashboard loads the latest data on every open → Everyone stays informed
Setting Up File Access
For the live dashboard to read your Google Sheets, you need to grant access using one of these methods:
Recommended Share with Service Account
- 1. Open your Google Sheets
- 2. Click the "Share" button (top right)
- 3. Add the service account email shown in VibeFactory
- 4. Set permission to "Viewer"
- 5. Click "Send" or "Share"
Your spreadsheet remains private - only the service account can access it.
Make Spreadsheet Public
- 1. Open your Google Sheets
- 2. Click the "Share" button
- 3. Under "General access", select "Anyone with the link"
- 4. Set permission to "Viewer"
- 5. Click "Done"
Note: Anyone with the link can view the spreadsheet.
Perfect Use Cases for Live Google Sheets Dashboards
📋 Team OKRs & Goals
Track objectives and key results in Sheets → Dashboard shows live progress toward quarterly goals.
📊 Marketing Campaigns
Log campaign metrics in Sheets → Live dashboard for ROI, conversions, and channel performance.
📝 Survey & Form Responses
Google Forms responses flow to Sheets → Live dashboard visualizes all feedback collected so far, every time you open it.
🏢 HR & Recruiting
Track candidates in Sheets → Hiring managers see live pipeline and interview status.
Dynamic Dashboards from Google Sheets Data
A dynamic dashboard in Google Sheets terms means two things, and this generator delivers both. First, the layout itself is dynamic: the AI reads your actual columns and picks fitting charts, KPI cards, and tables for the data you have, rather than forcing your sheet into a fixed template. Second, the data is dynamic: the dashboard reflects your sheet's current contents at every load.
Edit a value, add rows, or let a Google Form append responses, then share the same link you always share. Viewers see the latest numbers on their next visit, with no republishing on your side. One connection, one URL, and a dashboard that keeps pace with your spreadsheet.
Frequently Asked Questions
What is a live Google Sheets dashboard? ▼
A live Google Sheets dashboard is a web dashboard that stays connected to your source spreadsheet. When the dashboard loads, it fetches the latest data straight from your Google Sheets, so edits by you or your team appear the next time the dashboard is loaded or refreshed. No re-uploading or republishing needed.
Can multiple people edit the spreadsheet? ▼
Yes! This is one of the best features. Multiple team members can edit the Google Sheets simultaneously, and the dashboard will show the most current data whenever it loads. It's perfect for collaborative teams.
Why do I need to share my spreadsheet? ▼
For the dashboard to read your Google Sheets data, it needs access permissions. You can either make the spreadsheet public or share it with our service account. Your data remains secure and is only used for dashboard visualization.
Is Google Sheets better than Excel for live dashboards? ▼
Both work great! Google Sheets has the advantage of native cloud storage and simultaneous multi-user editing. Excel files on Google Drive work equally well. Choose based on your team's workflow preference.
Can I connect Google Forms responses? ▼
Yes! Google Forms automatically saves responses to a linked Google Sheets. Connect that sheet to VibeFactory, and you'll have a live dashboard that shows all form submissions received so far each time it loads. Use the Refresh button to pull in the newest responses while viewing.
Can I make my dashboard private or password-protected? ▼
Yes! When creating a new project, select "Private" from the visibility dropdown. Private dashboards are automatically password-protected, so only users with the correct password can view your data. This is ideal for sensitive business metrics, financial KPIs, or confidential team analytics.
Ready for Live Google Sheets Dashboards?
Create your first live dashboard in minutes. Connect Google Sheets once and never re-upload your data again.