Turn your sheet into a live dashboard.
Connect a sheet or upload a file. AI builds the charts, KPIs, and tables.
Used by 200+ teams this week
Your dashboard stays current with your sheet
Edit your Google Sheet, then open or reload your dashboard. It fetches your latest data on every load. No re-uploads, no republishing.
| 1 | Month | Revenue |
| 2 | July | $42,300 |
| 3 | August | $45,100 |
| 4 | September | $48,500 |
You edit a cell in your sheet…
September Revenue
$48,500
…and the dashboard shows it on its next load.
Start from a template, connect your own sheet
8 templates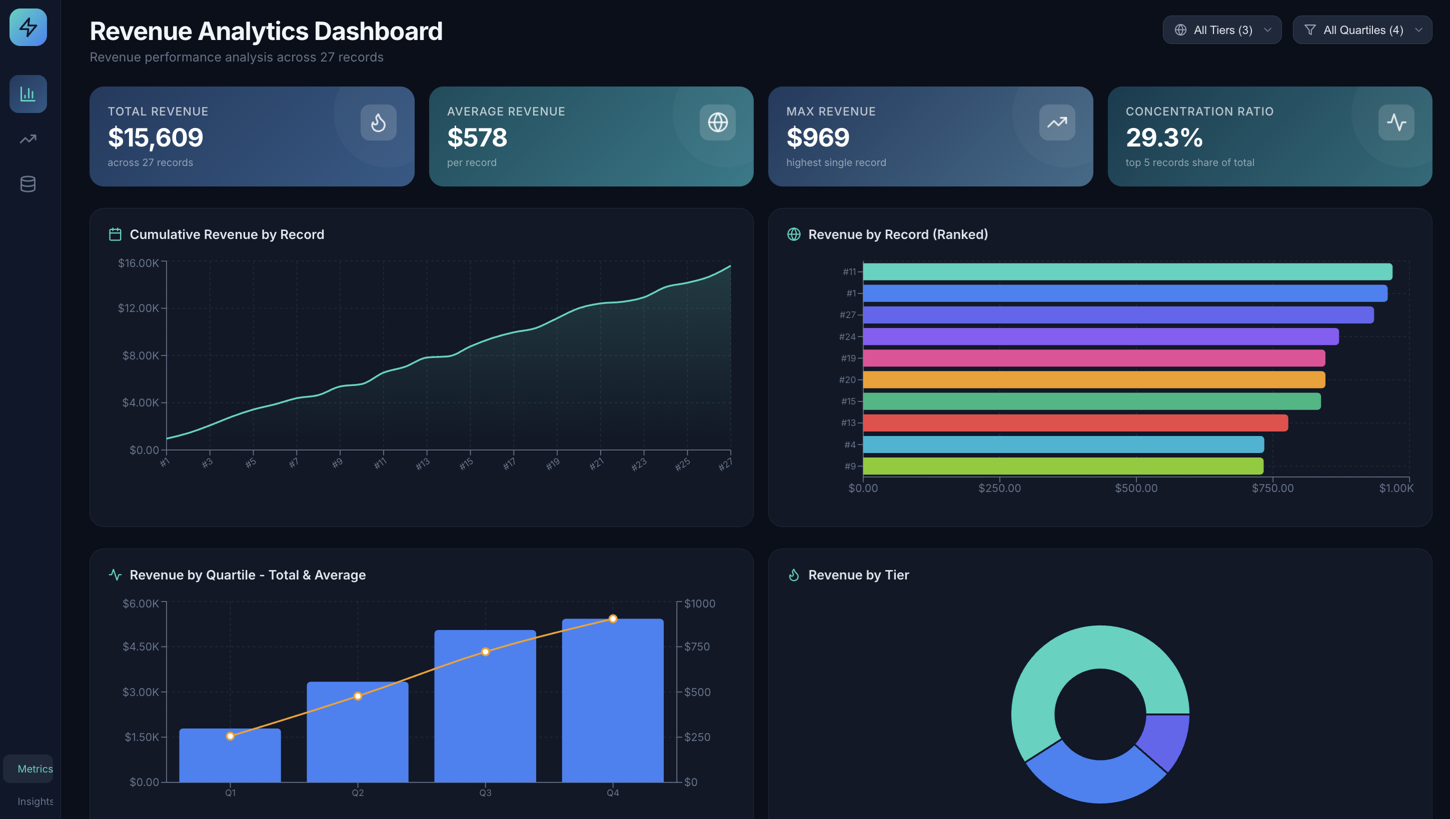
Marketing Analytics
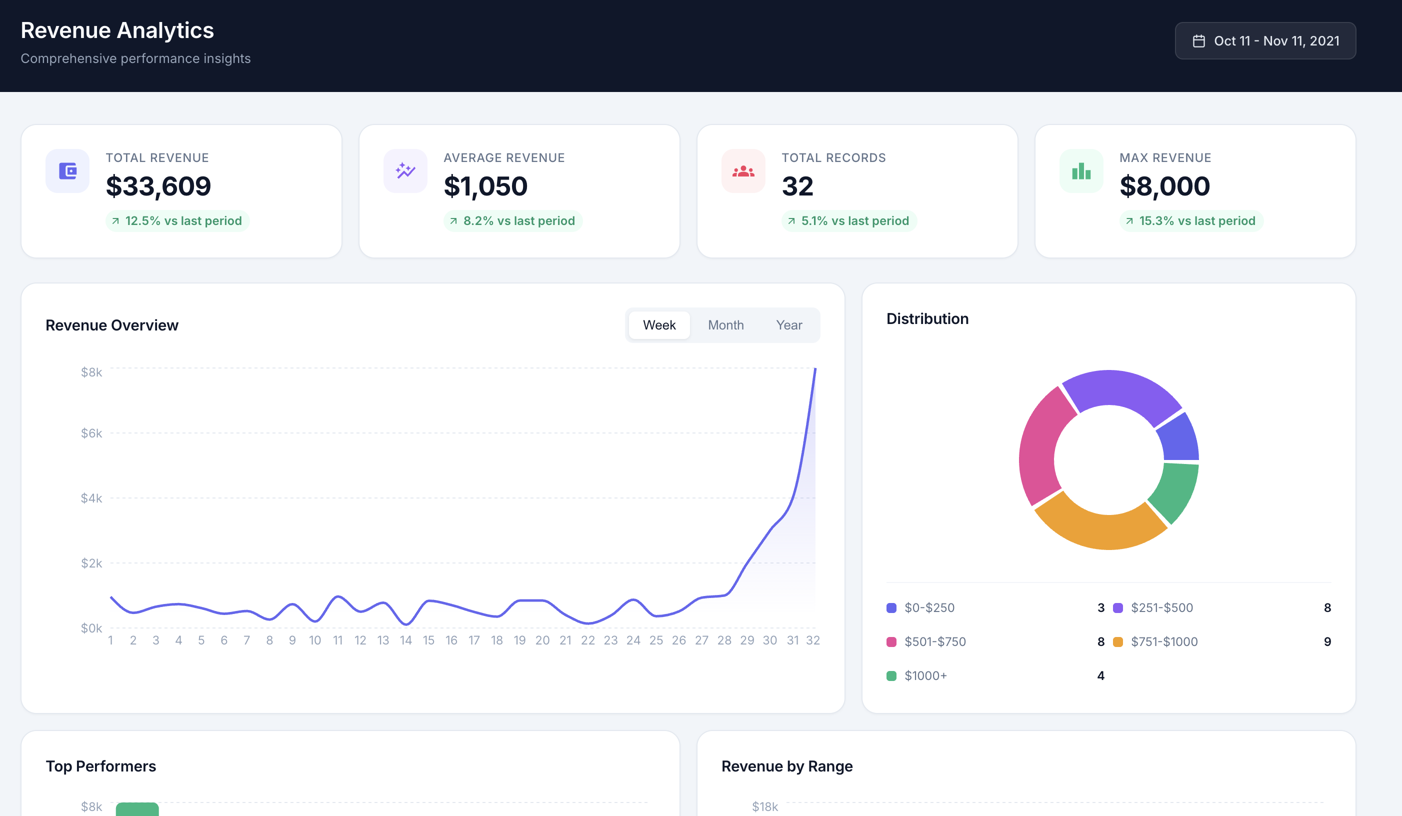
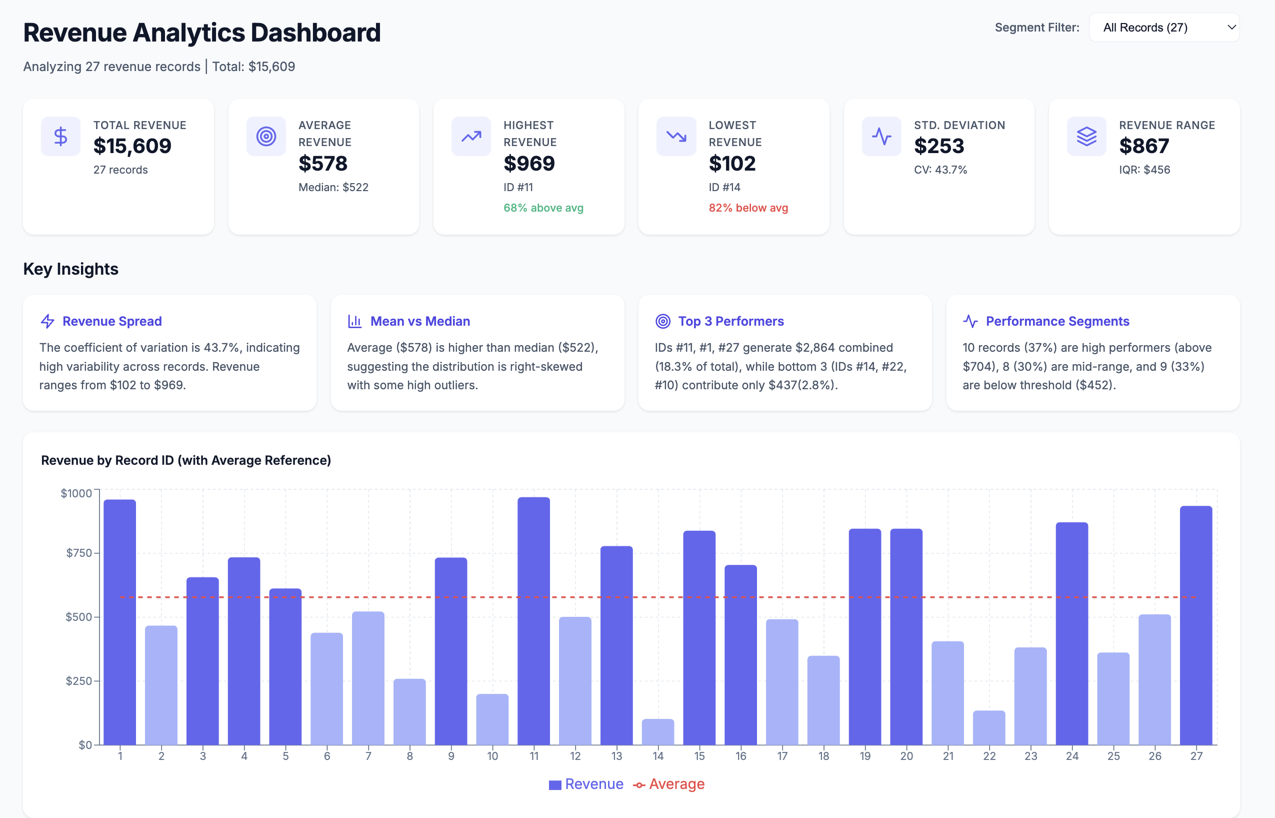
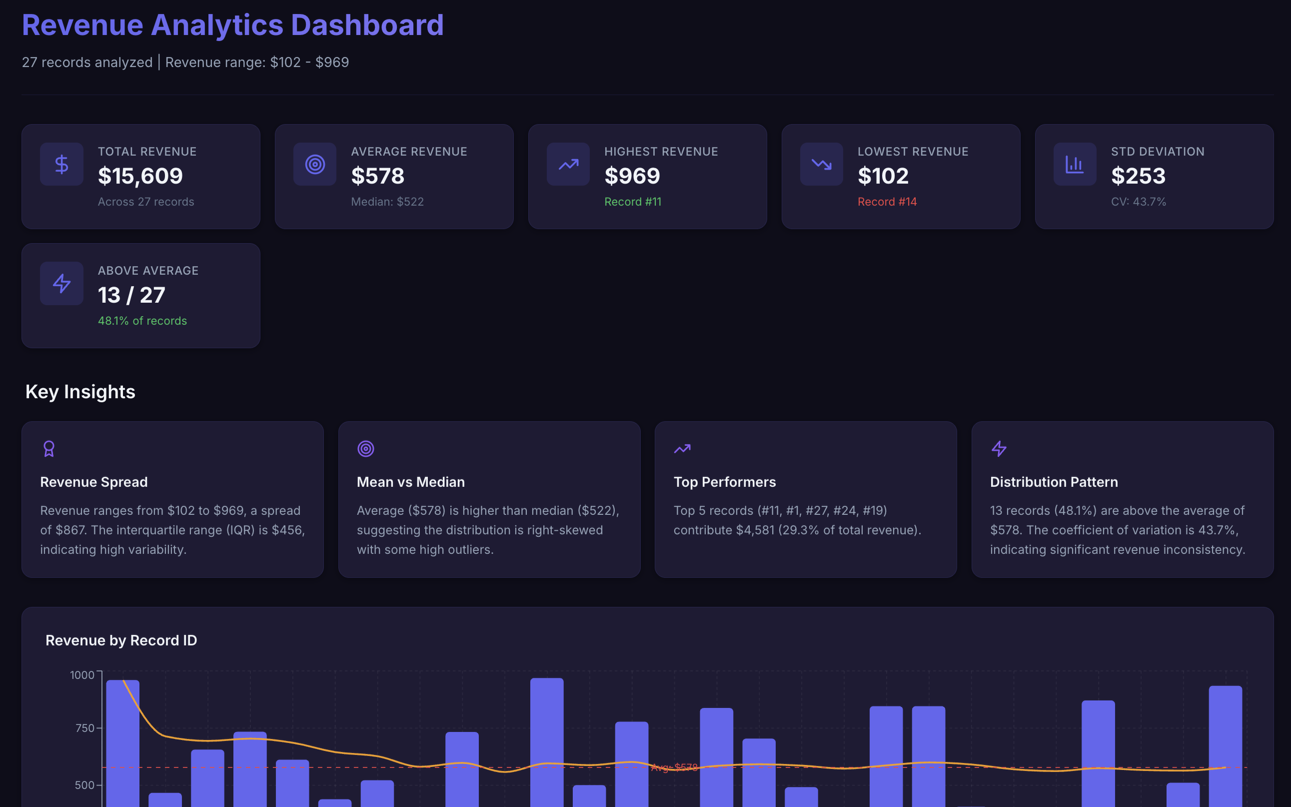
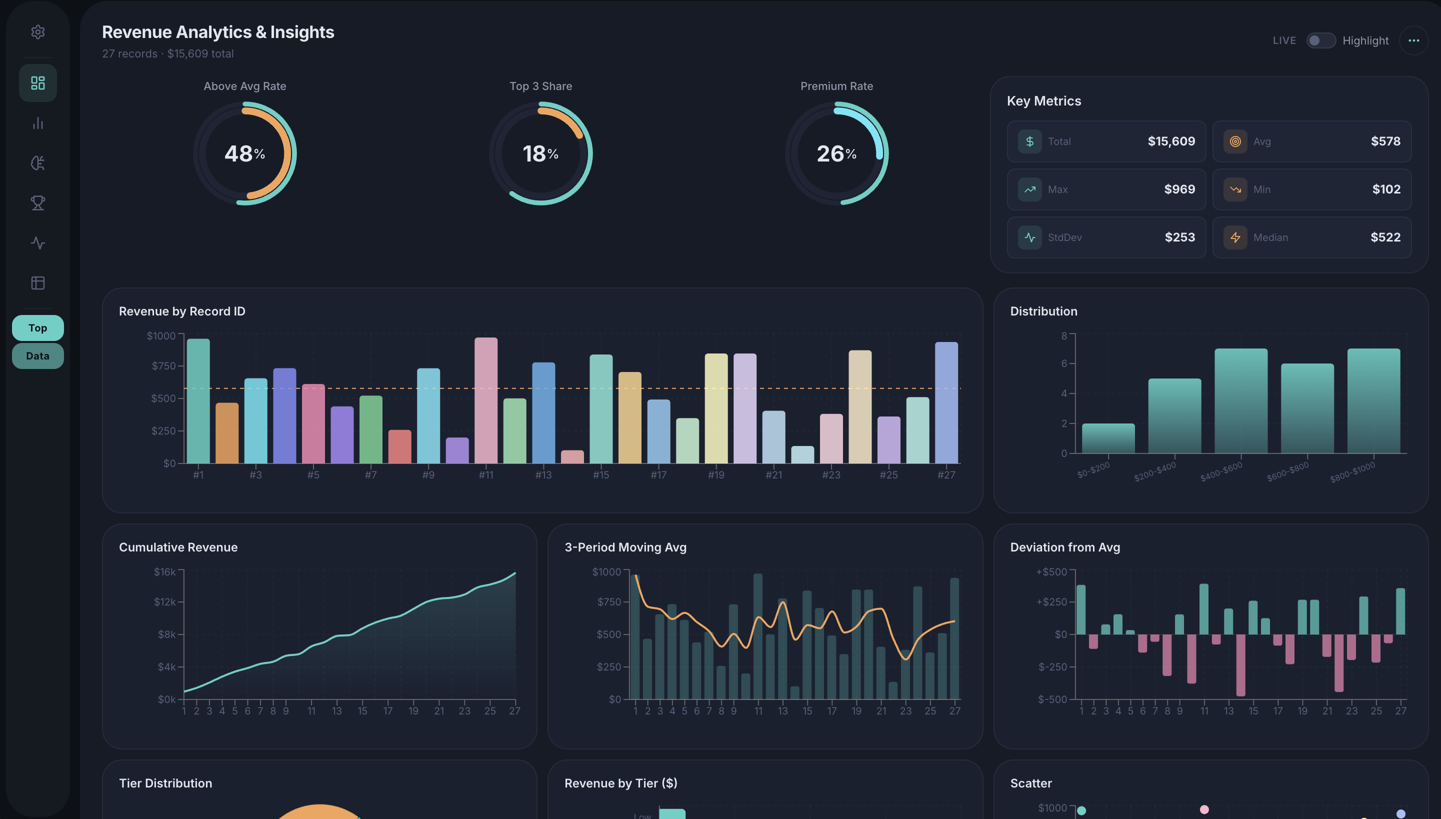
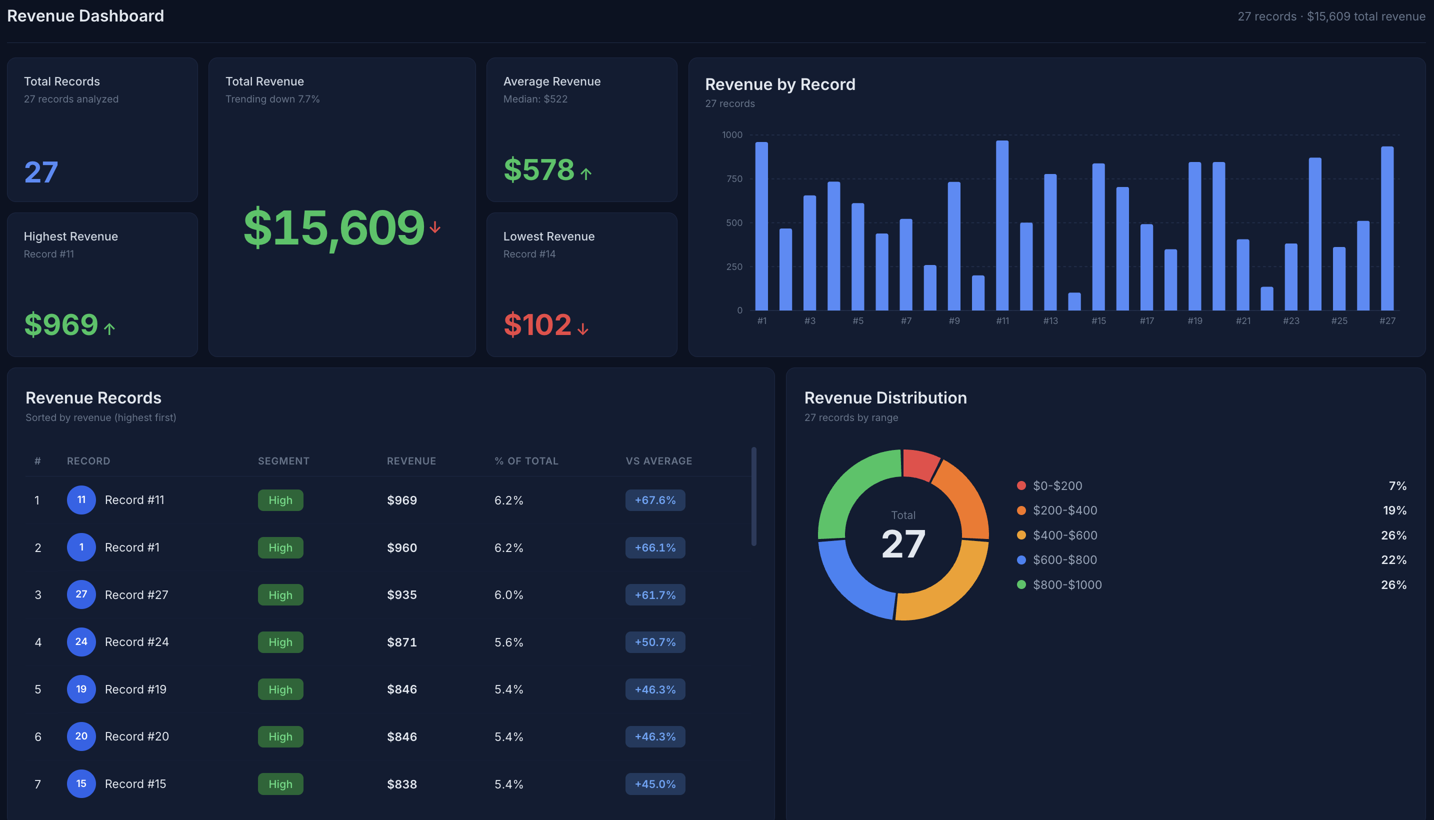
Revenue Analytics
Sales Dashboard
Operations Overview
HR Analytics
Inventory Tracker
Project Management
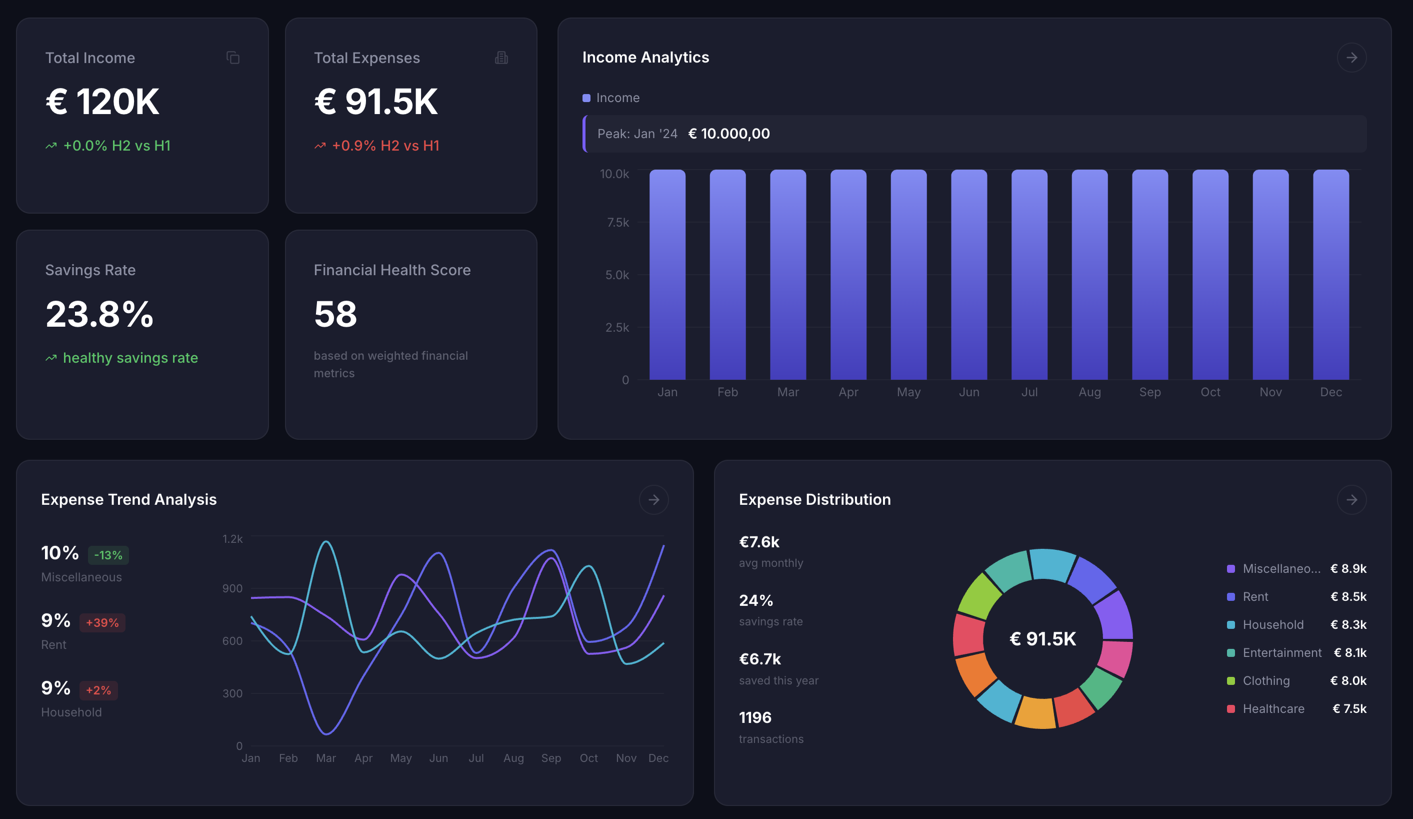
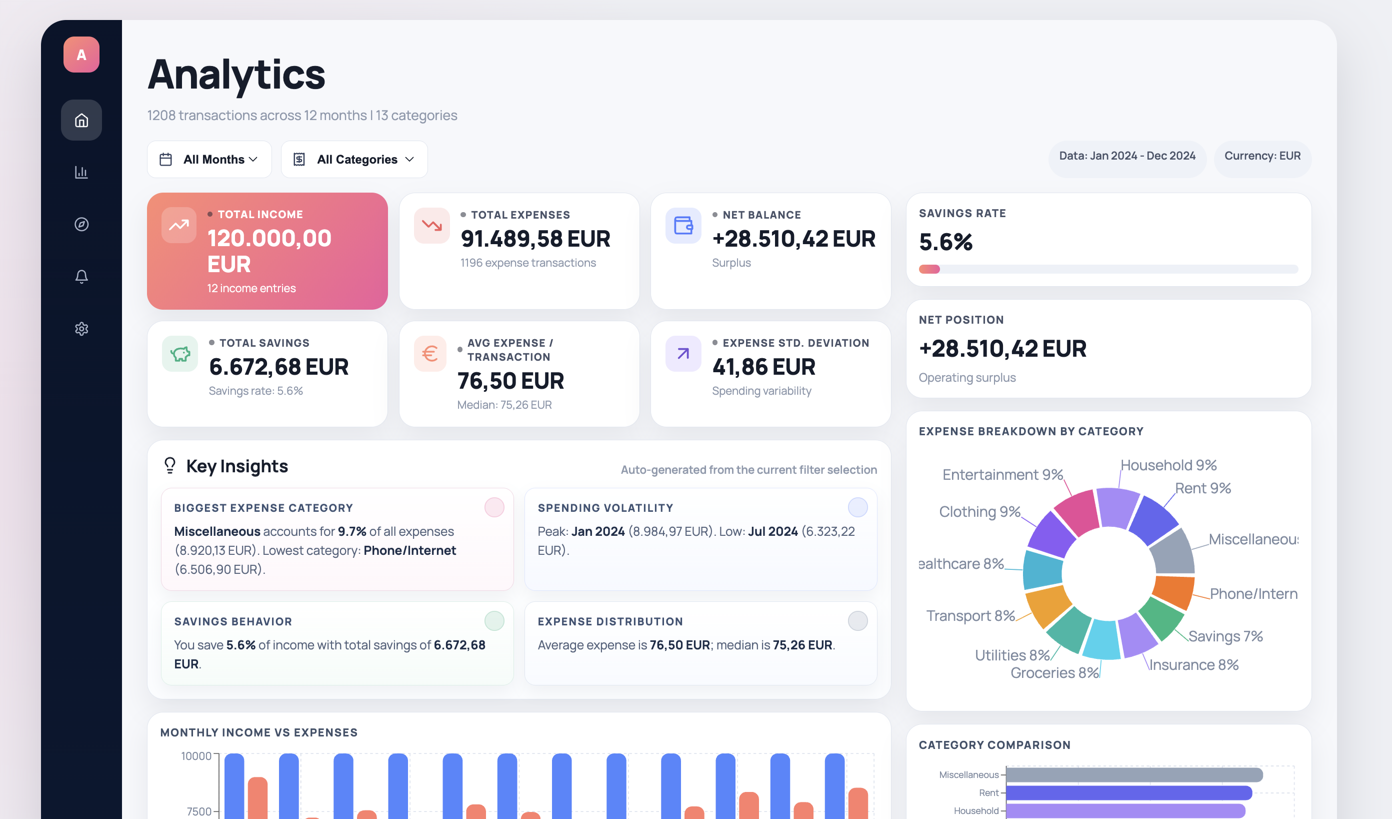
Financial Reports
From Data to Dashboard in Minutes
Connect your Google Sheet or upload a file, and let AI do the layout, charts, and insights.
Connect Your Google Sheet
Or upload a CSV, Excel, or JSON file for a one-off dashboard. We read your columns and understand the structure.
Working with files? See the upload guides below.
AI Builds the Dashboard
We generate charts, KPI cards, and tables in a clean, readable layout.
Share the Link
Deploy to a live URL in one click. Your dashboard shows your sheet’s current data on every visit. No re-uploads.
Dashboard-First Features
Everything you need to go from raw data to a live, shareable dashboard.
Live Google Sheets Dashboards
Connect a sheet once. Your dashboard shows its current data on every load. No exports, no re-uploads.
Live Google Sheets Guide →Smart Chart Selection
Automatically picks the best visualizations for each column and metric.
KPI & Summary Cards
Highlight the key metrics at a glance with clean, readable KPI tiles.
Data-Aware Tables
See the exact rows behind your charts with clean, sortable tables.
One-Click Publish
Share a real URL instantly—no local setup, no waiting.
Full Code Ownership
Export to GitHub anytime. No vendor lock-in—you own 100% of your code.
Iterate in Seconds
Refine layouts and change chart types with quick prompt edits.
Private Dashboards
Password-protect dashboards with sensitive data. Included with paid plans.
See what your dashboard could look like
Start with a CSV, Excel, or JSON file and get a clean, interactive layout with charts, KPIs, and tables.
- Upload CSV, Excel, or JSON data
- Auto-generates charts, tables, and KPI cards
- Publish as a standalone web app instantly
👆 Live Dashboard - Try interacting with it!
Generate Your First Dashboard Today
Go from raw data to a live, shareable dashboard in one session.
Create Your DashboardNeed a Custom AI Solution for Your Business?
We build enterprise AI systems — document search, workflow automation, and intelligent agents. 20+ years IT experience, Google Cloud & AWS certified.