What Are Dashboard Templates?
Dashboard templates are pre-built, professionally designed dashboard layouts that you can use as a starting point for your own data. Instead of describing what you want from scratch and hoping the AI gets it right, you pick an existing design you like and the AI reproduces that exact layout with your data.
The result? You get the exact same UI — the same chart types, the same color scheme, the same KPI cards, the same layout — just with your numbers instead of the sample data.
How it works:
- Upload your data (Excel, CSV, Google Sheets, or database)
- Browse available templates and pick one you like
- The AI generates your dashboard using that template's design
- Your dashboard is deployed instantly with your own data
There are two categories of templates, each designed for a different type of data source: Excel Dashboard templates for static files and Live Dashboard templates for connected data sources.
Excel Dashboard Templates (For Static Data)
Excel Dashboard templates are designed for static file uploads — when you have an .xlsx, .xls, or .csv file that you want to turn into a visual dashboard. These templates are perfect for:
- Monthly reports — revenue, expenses, P&L summaries
- Sales data exports — CRM exports, pipeline snapshots
- HR analytics — headcount, turnover, hiring data
- Inventory snapshots — stock levels, order history
- Marketing metrics — campaign performance, ROI analysis
- Any spreadsheet data you want to visualize as a one-time dashboard
When you select an Excel Dashboard template, the AI analyzes your uploaded file, maps your columns to the template's data structure, and generates a dashboard with the exact same visual design — KPI cards, bar charts, line graphs, pie charts, and data tables — filled with your actual data.
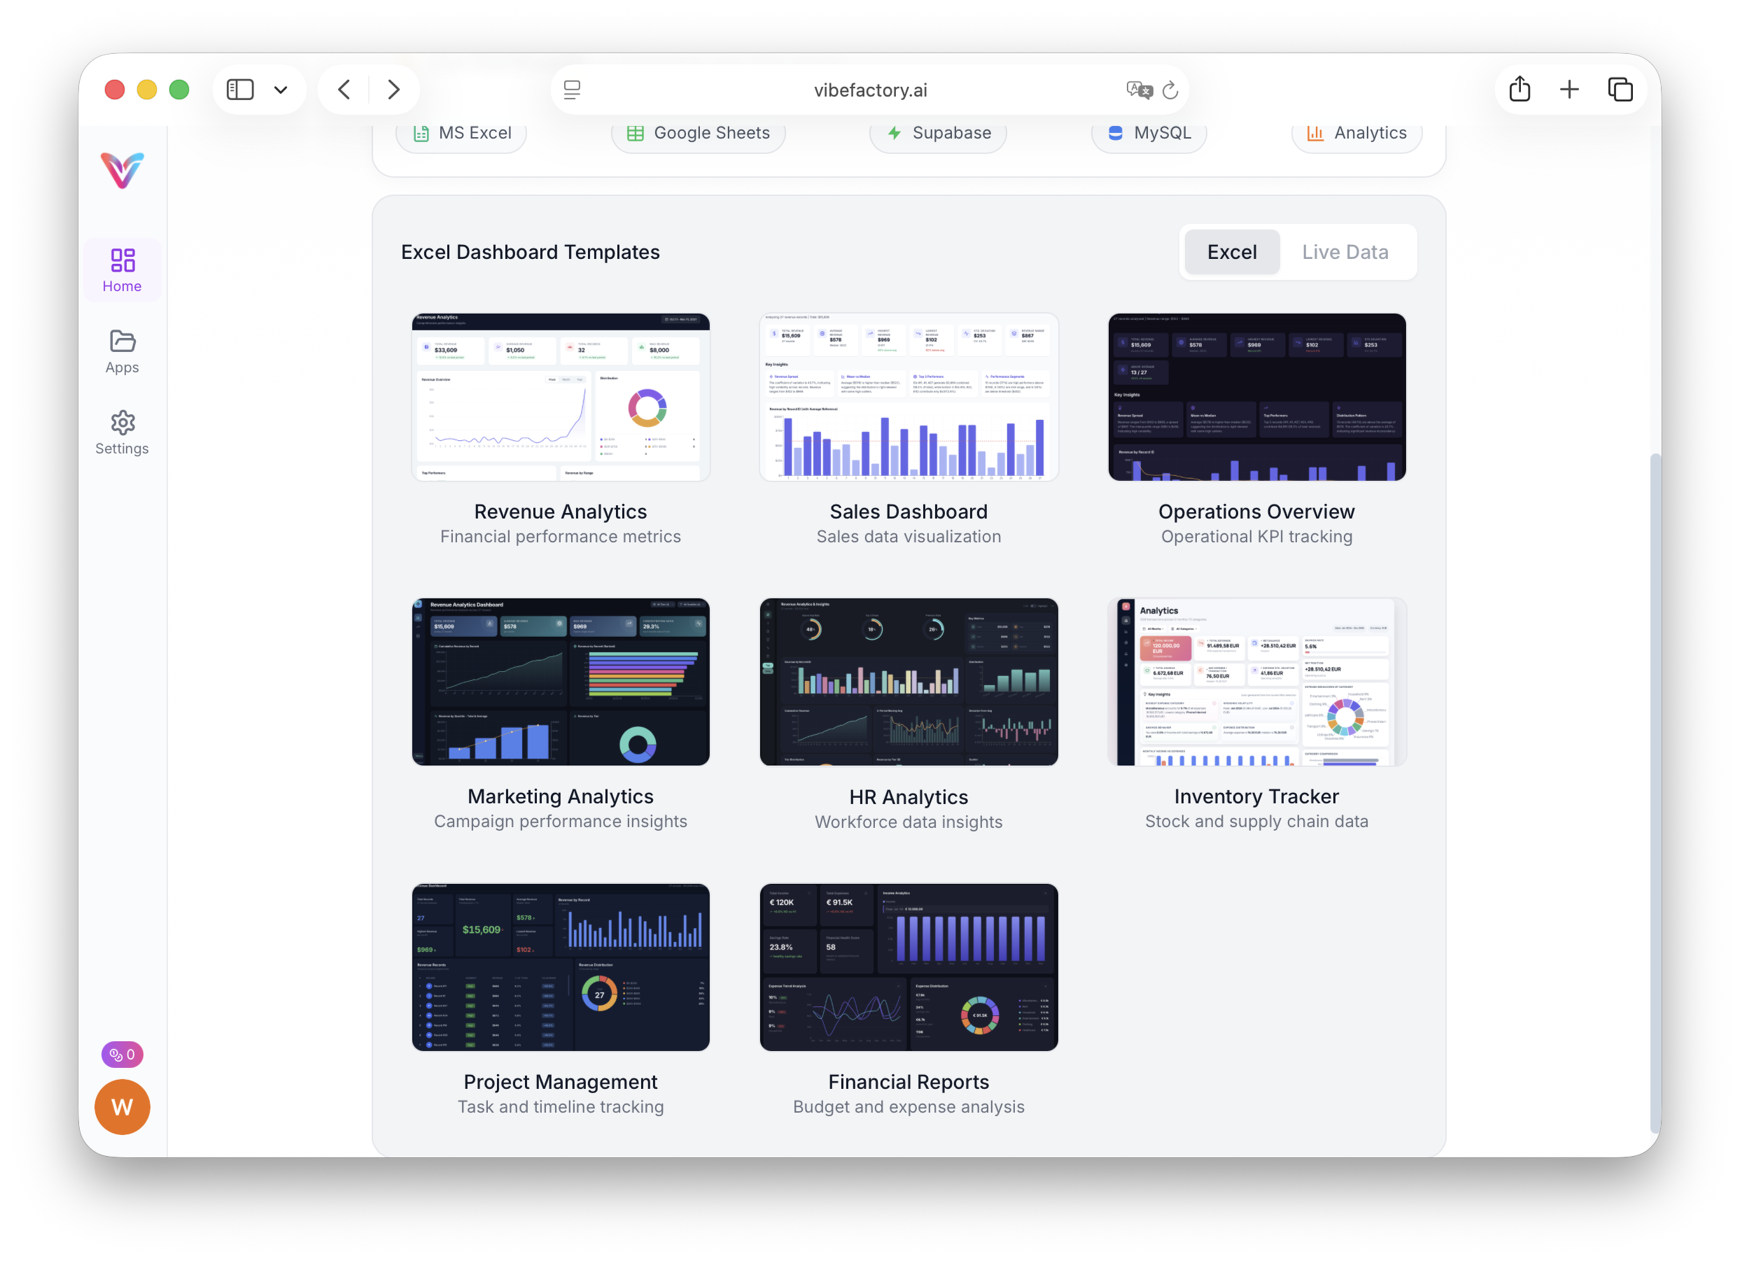
Excel Dashboard templates — select one to generate a dashboard from your uploaded spreadsheet
Live Dashboard Templates (For Connected Data Sources)
Live Dashboard templates are built for connected data sources that keep changing. Connect once and never re-upload: the dashboard fetches your source's current data every time it loads, and a Refresh button pulls the latest numbers on demand. These templates work with:
- Google Sheets — live spreadsheets shared via Google Drive
- Databases — MySQL, PostgreSQL, Snowflake, Supabase, Databricks
- Google Analytics — website traffic and conversion data
- Excel on Google Drive —
.xlsxfiles stored on Google Drive, read fresh on every dashboard load
The key difference from Excel templates: Live Dashboard templates generate dashboards that read directly from your connected source. Update a row in your Google Sheet, then reload the dashboard or press Refresh, and the change is there. Run an INSERT on your database, and the new data appears the next time the dashboard loads. No exports, no re-uploading.
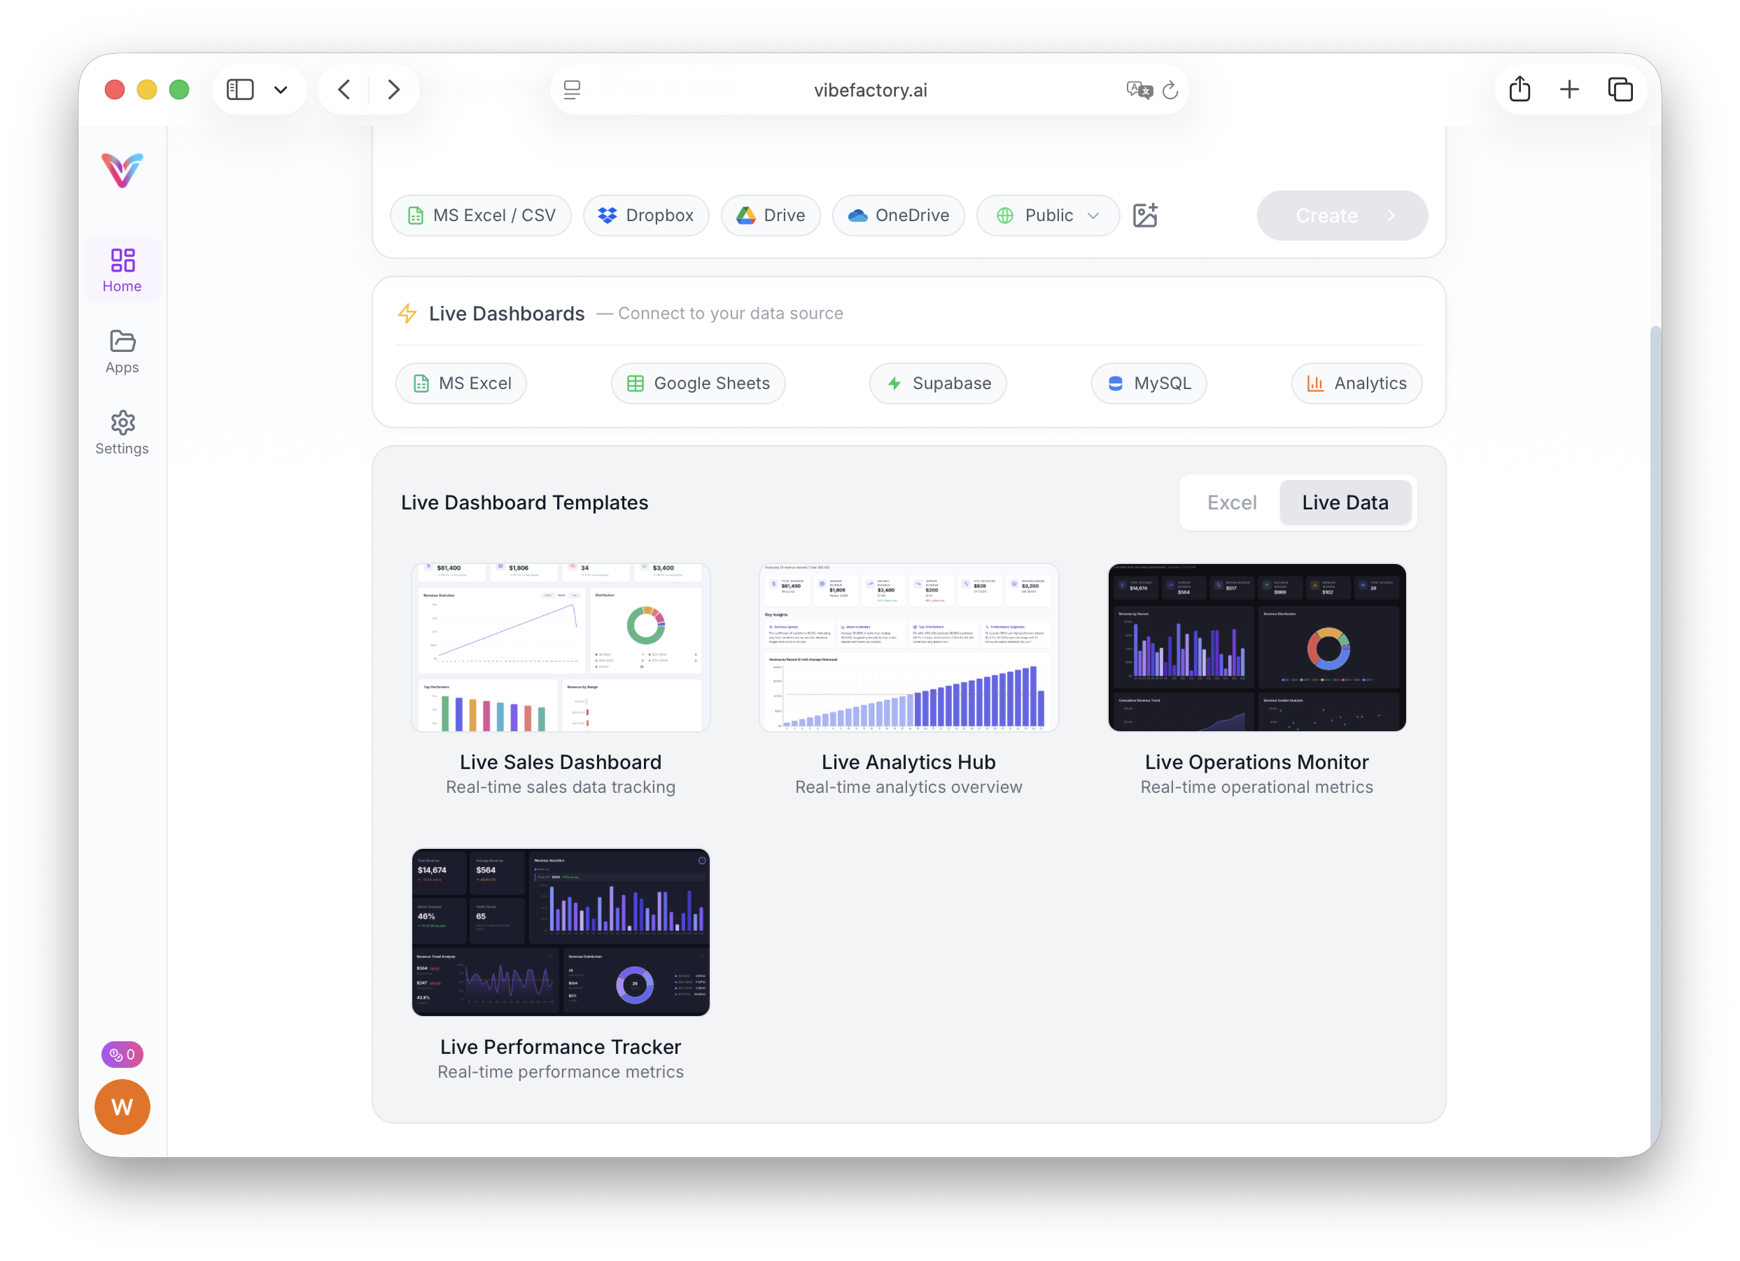
Live Dashboard templates, designed for connected sources like Google Sheets and databases
Which Template Type Should You Use?
| Criteria | Excel Dashboard Templates | Live Dashboard Templates |
|---|---|---|
| Data source | Uploaded .xlsx, .xls, .csv files | Google Sheets, databases, Google Analytics, Excel on Google Drive |
| Data updates | Static snapshot at upload time | Live: shows the source's current data on every load or Refresh |
| Best for | One-time reports, periodic snapshots, data exports | Ongoing monitoring, live KPIs, team dashboards |
| Example use case | "I exported Q1 sales data and need a dashboard for my presentation" | "I want a live sales dashboard that updates as deals close in our CRM" |
| Result | Exact same UI as template, with your uploaded data | Exact same UI as template, with your live data feed |
Quick rule of thumb:
If you're uploading a file from your computer, use an Excel Dashboard template. If you're connecting to a live data source (Google Sheets, database, or Google Analytics), use a Live Dashboard template.
What You Get: The Exact Same UI, Your Own Data
The most important thing to understand about dashboard templates is this: the dashboard you generate will look exactly like the template you selected. The AI doesn't just use the template as a rough guideline — it reproduces the layout faithfully.
This means:
- ✓ Same chart types — if the template has bar charts, line graphs, and pie charts, your dashboard will have the same visualization types
- ✓ Same color scheme — the template's color palette is preserved in your generated dashboard
- ✓ Same KPI cards — summary metrics at the top, trend indicators, and comparison values
- ✓ Same layout structure — header, grid arrangement, spacing, and responsive design
- ✓ Your data — the only thing that changes is the numbers, labels, and values displayed
This removes the guesswork from dashboard creation. Instead of writing detailed prompts hoping the AI understands your vision, you see exactly what you'll get before you generate.
How to Use Dashboard Templates (Step by Step)
Upload Your Data or Connect a Source
Start by uploading an Excel or CSV file from your computer. Alternatively, connect a Google Sheet, database, or Google Analytics account for a live dashboard. The data source you choose determines which template category is available.
Browse and Select a Template
After selecting your data source, you'll see a template picker. Browse the available designs — each template shows a preview so you know exactly what the final dashboard will look like. Click the one you want.
Add a Prompt (Optional)
You can optionally add a text prompt to customize the dashboard further — for example, "focus on Q1 revenue trends" or "highlight the top 5 products." If you don't add a prompt, the AI will use the template as-is with your data.
Generate and Deploy
Click generate. The AI builds your dashboard using the template's layout and your data. Within minutes, your dashboard is live at a unique URL that you can share with your team, embed in a website, or bookmark for daily use.
Frequently Asked Questions
What's the difference between Excel and Live Dashboard templates?
Will my dashboard look exactly like the template?
Can I customize the dashboard after it's generated?
Which template should I use for my Google Sheets data?
Do I need coding skills to use templates?
Can I generate a dashboard without selecting a template?
Ready to Try Dashboard Templates?
Upload your spreadsheet or connect a live data source, pick a template, and get a professional dashboard in minutes. No coding, no design skills needed.
Create Your Dashboard NowRelated Articles
AI Excel Dashboard Generator
Upload your Excel file and convert it into an interactive dashboard in seconds using AI.
LIVELive Excel Dashboard Generator
Create dashboards from Excel on Google Drive that show your file's current data every time they load.
LIVELive Google Sheets Dashboard
Transform Google Sheets into live dashboards. Edit your spreadsheet, watch the dashboard update instantly.